Figure 3.

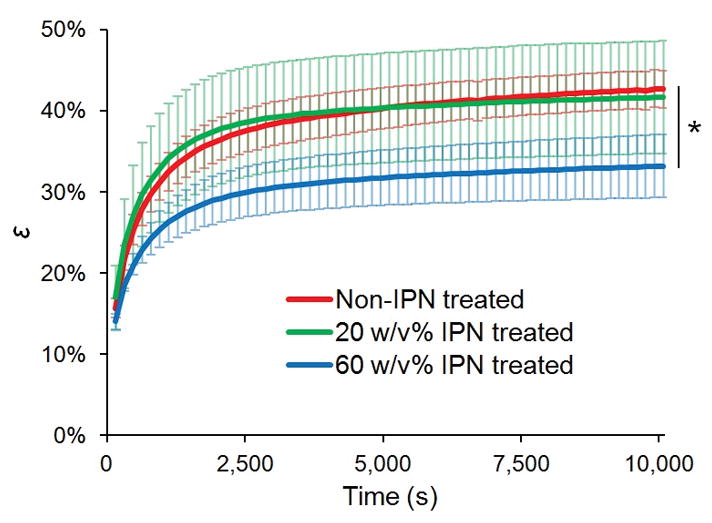
Compressive engineering strain, ε, as a function of time. Error bars represent standard deviations, N=3. * p = 0.022 comparing εeq of non-IPN treated vs 60 w/v% IPN treated cartilage.

Compressive engineering strain, ε, as a function of time. Error bars represent standard deviations, N=3. * p = 0.022 comparing εeq of non-IPN treated vs 60 w/v% IPN treated cartilage.