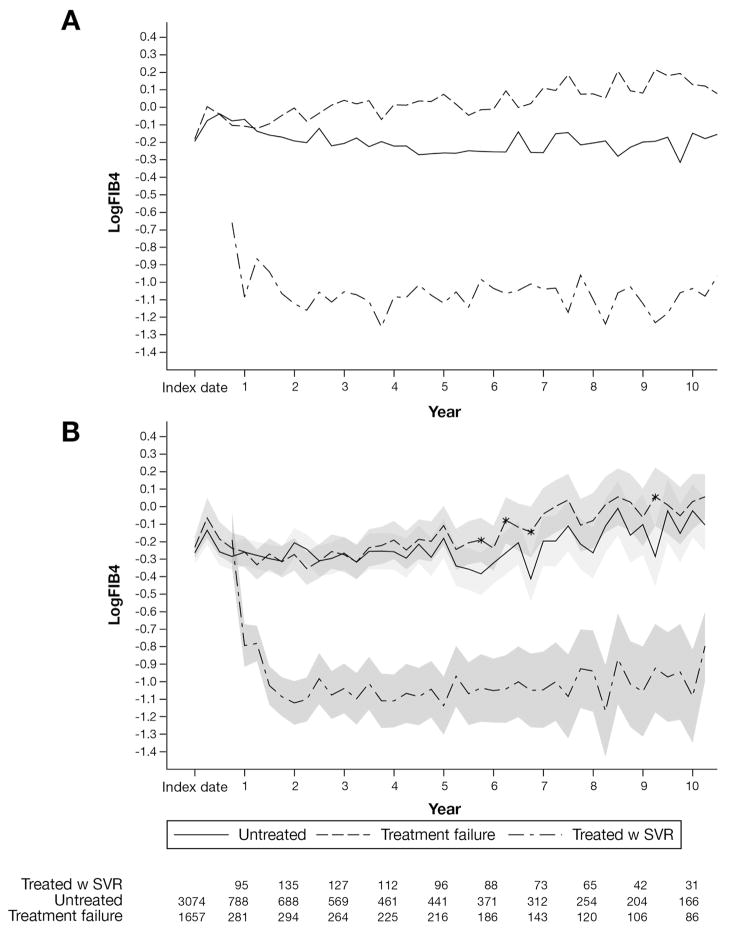
Figure 3.
Average observed (top) and predicted (bottom) logAPRI with 95% confidence bands (shaded) over 41 intervals of 90 days by group. Treatment failure and untreated patients were compared at each time interval. *Significant difference between treatment failure and untreated patients at a specific time interval (P < .05). The number of patients at each time point is noted at the bottom.

