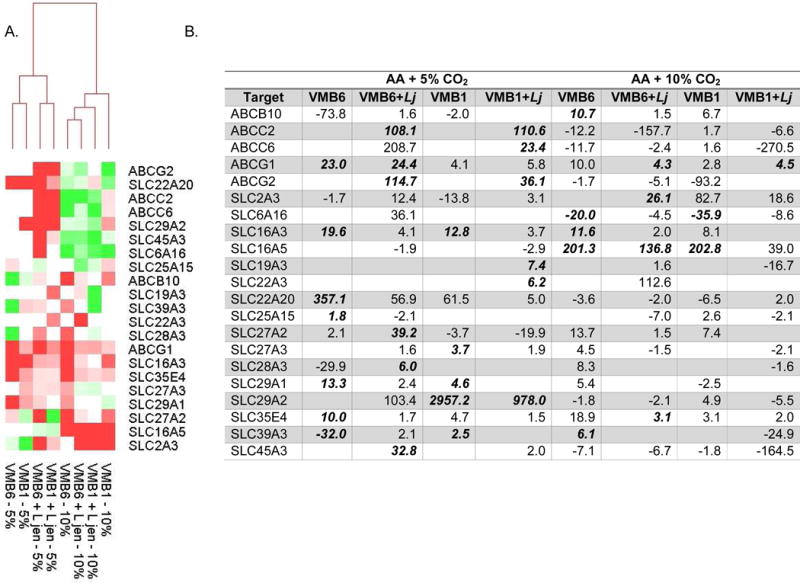
Figure 4. Clustering and fold change evaluations of selected molecular transporter genes related to the shifted VMB community profiles produced by increased luminal CO2.

Data for selected molecular transporter genes are presented as described in Fig. 3. (A) Heat map relational clustering illustrated grouping of 5% CO2 conditions regardless of VMB or L. jensenii supplementation. (B) Average fold change values for the clustered data again are provided for those conditions that led to altered gene expression. Values that were significantly different (p<0.05) are bolded. At least 3 values are considered for each condition.
