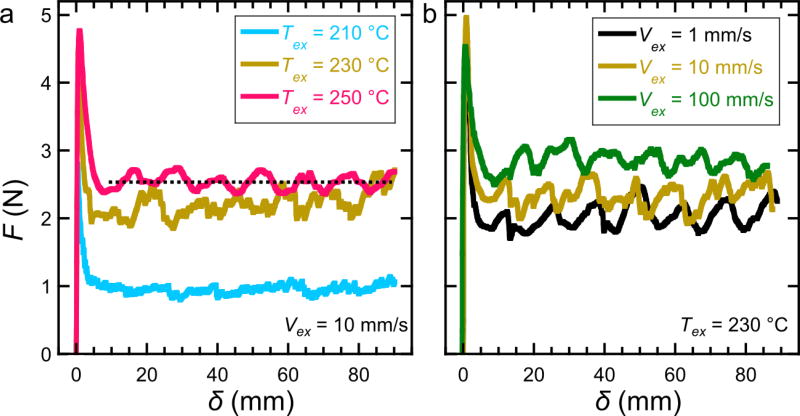
Figure 2.
Representative force, F, versus crosshead displacement, δ, curves illustrating response of tear testing for samples prepared at various (a) extruder temperatures at a constant extruder velocity (Vex = 10 mm/s) and (b) various extruder velocities at a constant extruder temperature (Tex = 230 °C). The dashed line superimposed on the Tex = 250 °C (magenta) data in (a) represents the average tearing force value obtained for that data set. The values on the y-axis in (a) apply to both plots. The average tear force utilized in calculation of tearing energy is obtained from averaging 5 experimental data sets.

