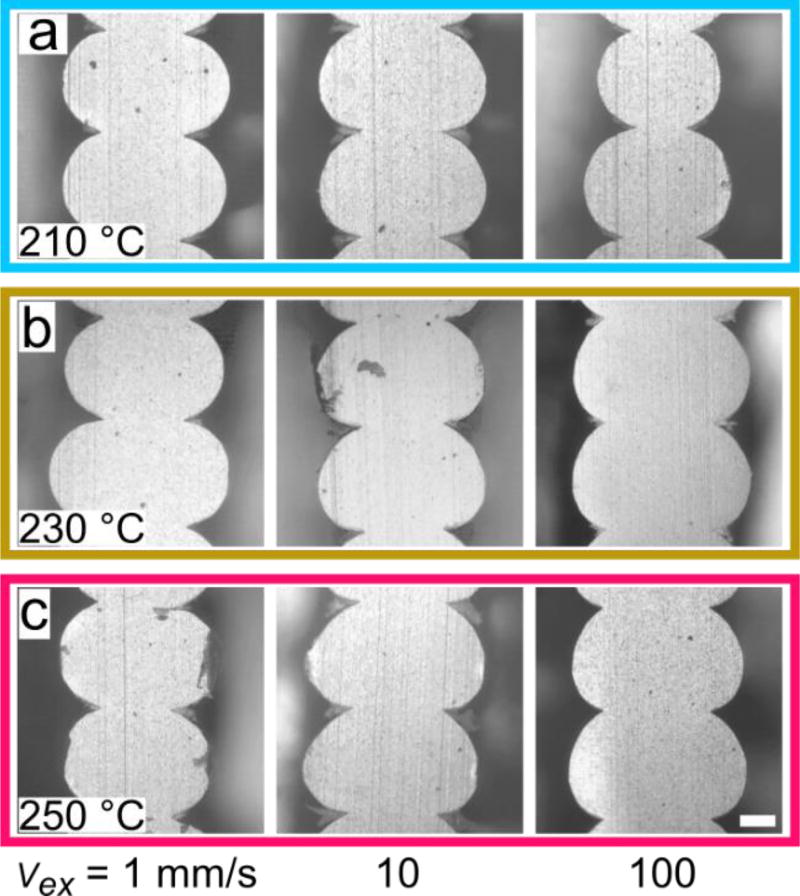
Figure 3.
Representative cross-section images of samples prepared at various processing conditions. Each row of images show samples prepared at (a) Tex = 210 °C, (b) Tex = 230 °C, and (c) Tex = 250 °C. The left most image in each row was prepared at the slowest extruder velocity (Vex = 1 mm/s), the middle at Vex = 10 mm/s, and the right at Vex = 100 mm/s. The scale bar is 100 µm and applies to all images.

