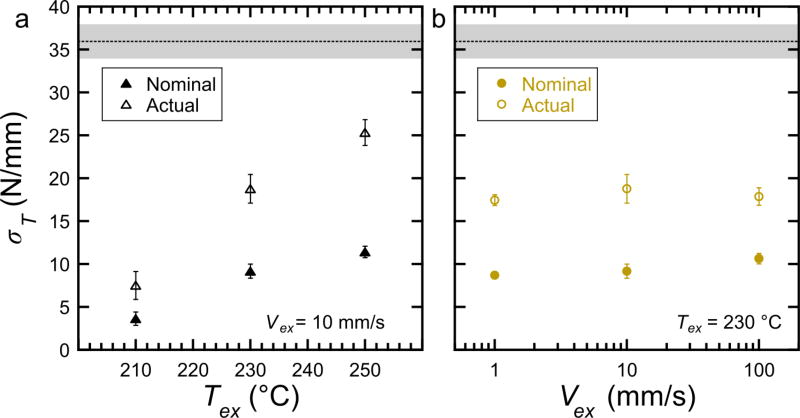
Figure 5.
Tearing energy, σT, as a function of (a) extruder temperature and (b) extruder velocity. In both figures, filled symbols show the nominal σT while open symbols represent the actual σT averages. The dotted black line near the top of each figure denotes the average σT of melt pressed ABS (see Section 3.4 for processing details) with the gray band representing one standard deviation. Error bars represent one standard deviation. The values on the y-axis in (a) apply to both plots.

