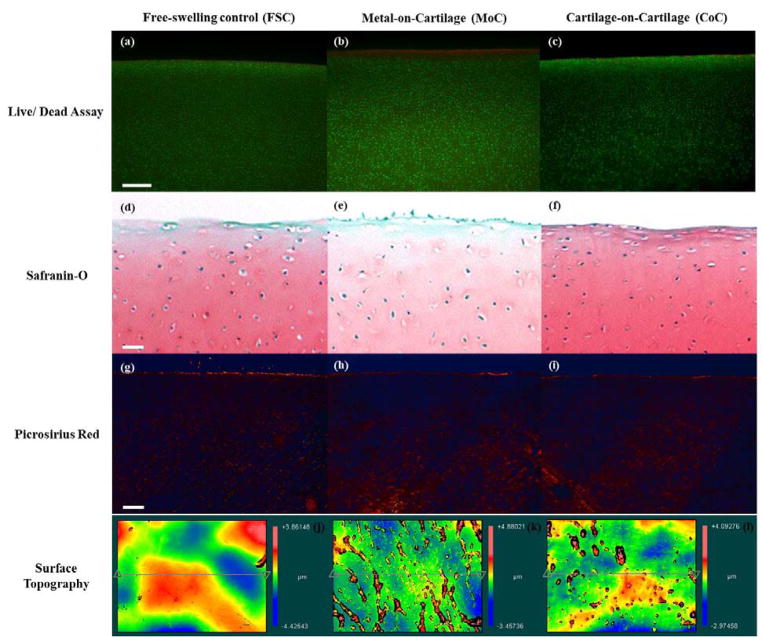
Figure 3.
Live/dead cross-sections of the cartilage explants from (a) FSC, (b) MoC, and (c) CoC groups stained with calcein AM (green; living chondrocytes) and ethidium homodimer (red; dead chondrocytes) at 5x. Representative cross-sections of the cartilage explants from (d) FSC, (e) MoC, and (f) CoC groups stained with Safranin-O for GAG at 4x magnification. Representative cross-sections of the cartilage explants from (g) FSC, (h) MoC, and (i) CoC groups stained with Picrosirius red for collagen at 4x magnification. Representative topographical plots of average SRz values for (j) FSC, (k) MoC, and (l) CoC. (g) represents the native microfeatures of cartilage, while (h) displays an increase in microfibrillation features as compared to (g)and (i). Bar represents 250 μm.

