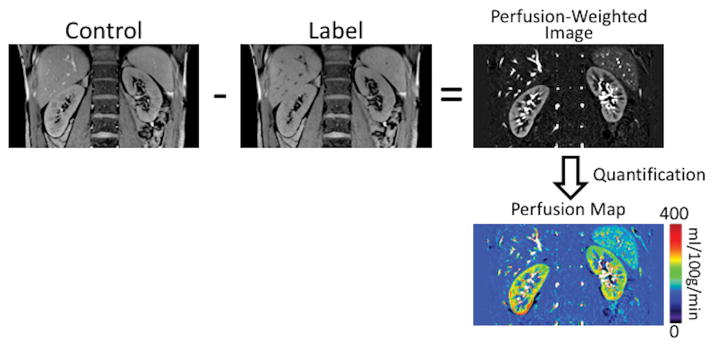
Figure 1.
Schematic of an ASL acquisition applied to estimate kidney perfusion. The acquisition includes a control image, where the magnetization is maintained at an equilibrium, and a label image, where the inflowing blood is selectively inverted. The subtraction of the label image from the control image generates the perfusion-weighted image. Using a separately acquired proton-density image and the perfusion quantification model, absolute perfusion maps in physiological values of ml/100g/min can be generated.

