
Figure 4.
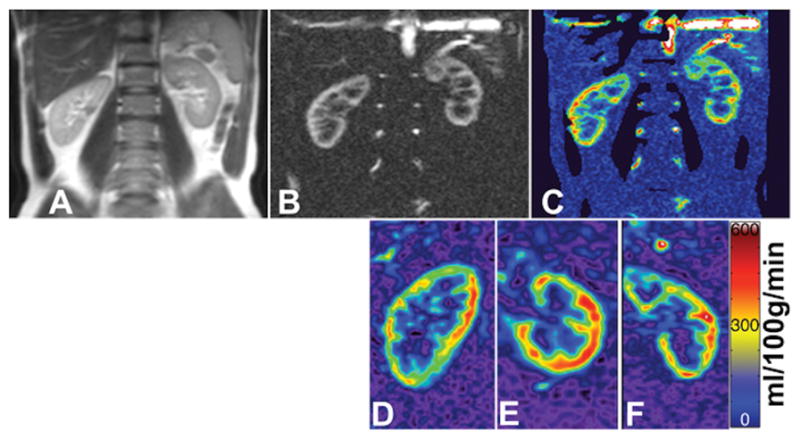
Perfusion images obtained from the kidneys of a healthy volunteer acquired using pCASL. Shown are a T2-weighted image (a), PWI using 2D pCASL (b), 2D quantitative perfusion map (c), and 3D quantitative perfusion maps (d–f). 3D images were acquired in the sagittal (d) orientation and reformatted to axial (e) and coronal (f) planes. Images were acquired with pCASL labeling using background suppression and Cartesian acquisition with a 2D SShTSE (b,c) and 3D TSE (d–f).