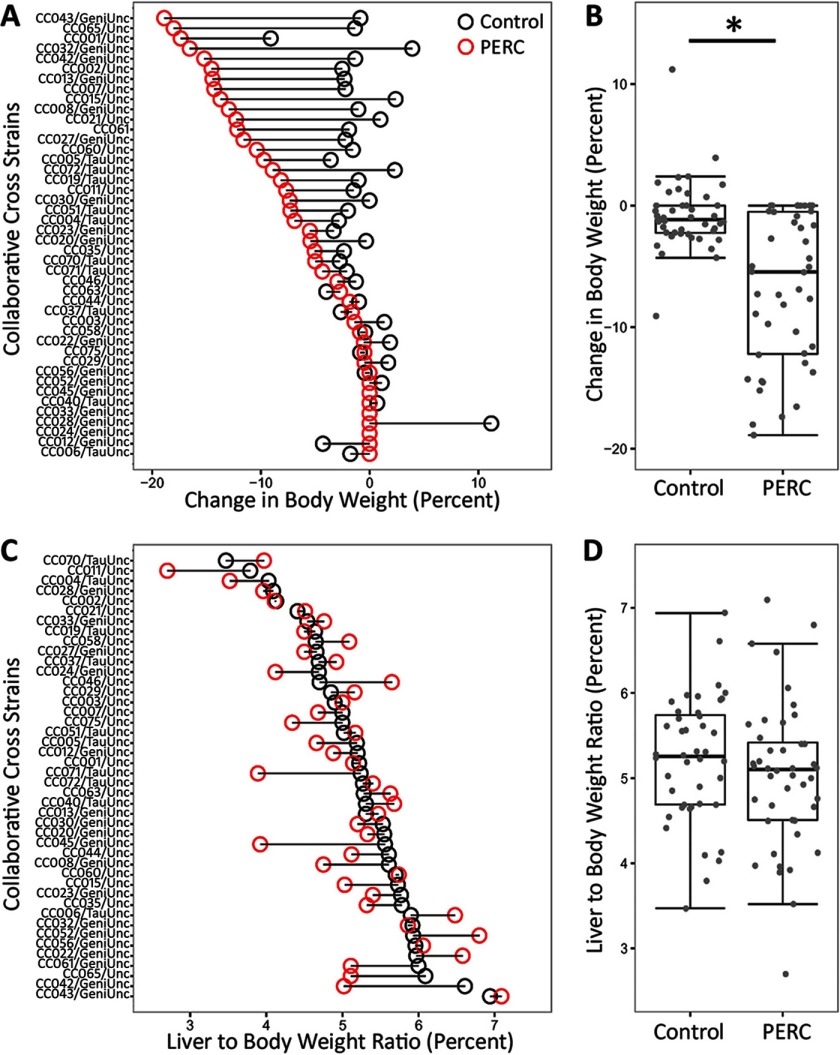
Figure 2.
Relative change in bodyweight (A,B) and liver to body weight ratio (C,D), as compared to pre-treatment weight, in vehicle- (black dot) and PERC- (, i.g., red dot) exposed Collaborative Cross mice 24 hr following a single intragastric gavage. A and C show change in the individual strains that were ordered according to the change in body weight in PERC-treated mice (A), or liver to body weight ratio in vehicle-treated mice (C). B and D show population averages as box and whisker plots. The box represents the interquartile range (IQR), the black line represents the median, and the whiskers represent and . The asterisk (*) denotes significant difference () between treatment groups (unpaired t-test).

