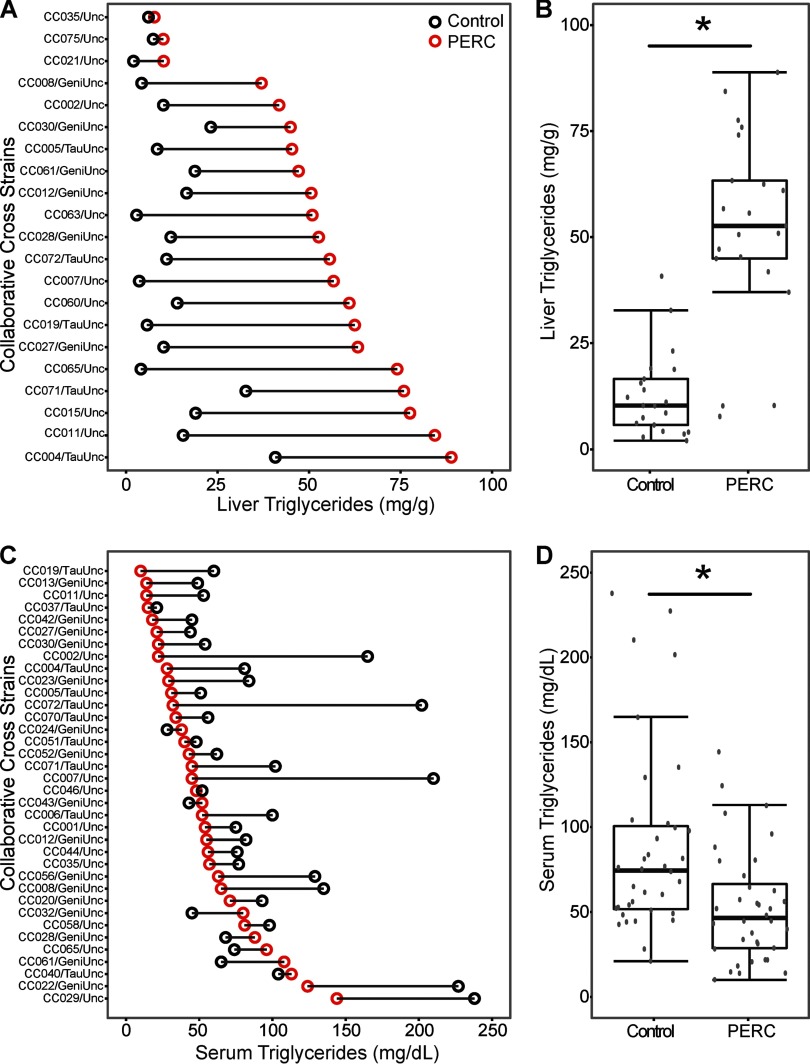
Figure 3.
Differences in liver (A,B) and serum (C,D) triglyceride levels in vehicle- (black dot) and PERC- (, i.g., red dot) exposed Collaborative Cross mice 24 hr following a single intragastric gavage. A and C show change in the individual strains that were ordered according to the values in PERC-treated mice. B and D show population averages as box and whisker plots (see Figure 2 for the legend). The asterisks (*) denote significant differences () between treatment groups (unpaired t-test).

