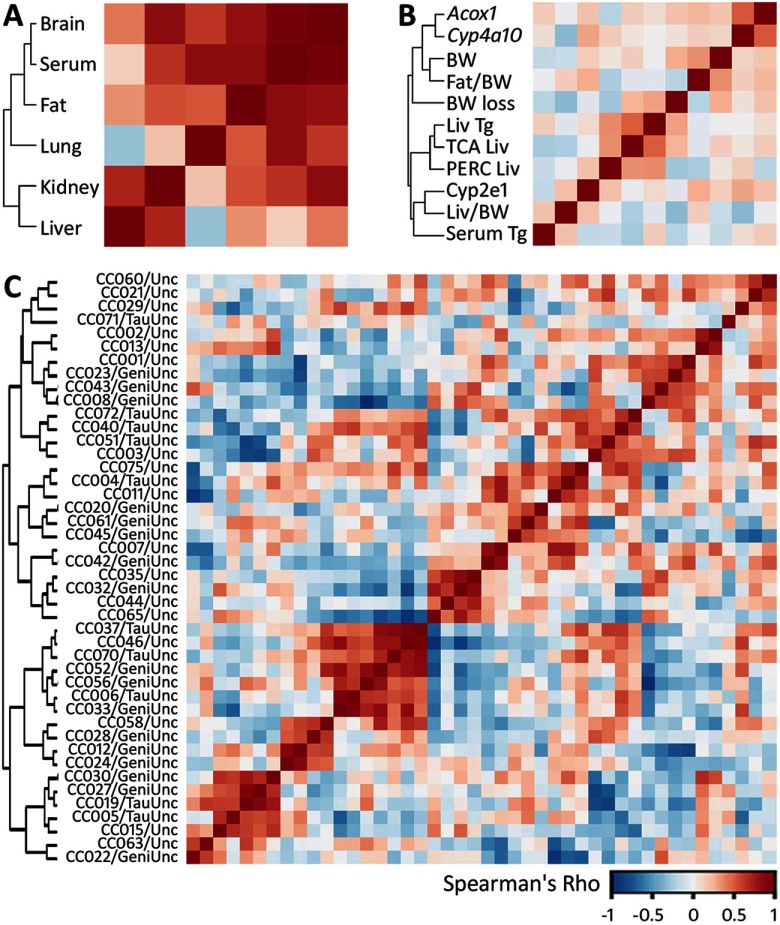
Figure 6.
Correlation matrices (colored according to the value of pairwise Spearman’s correlation for the phenotypes included in each analysis; see color bar scale) for toxicokinetic and toxicodynamic phenotypes across the population of Collaborative Cross strains. Unsupervised hierarchical clustering among parameters is shown by the dendrogram. (A) Heatmap of TCA partial AUCs (0–24 hr) in multiple tissues from a subset of nine strains of the Collaborative Cross treated with a single dose of PERC (see Figure S2 for concentration–time profiles). (B) Heatmap of toxicodynamic and toxicokinetic responses to PERC across the population. Abbreviations: Acox1 and Cyp4a10 = induction of Acox1 and Cyp4a10 after PERC exposure; BW = basal bodyweight; Fat/BW = fat-to-bodyweight ratio; BW loss = loss of bodyweight after PERC exposure, percent; Liv Tg = liver triglycerides following PERC exposure; TCA Liv= TCA AUC in liver; PERC Liv = PERC AUC in liver; CYP2E1 = liver CYP2E1 levels in vehicle-treated mice; Liv/BW = liver-to-bodyweight ratio after PERC treatment; Serum TG = serum triglyceride levels after PERC treatment. For all phenotypic parameters except for metabolite data, values were normalized to vehicle-treated strain-matched controls. (C) Heatmap of correlations among strains based on the phenotypes shown in B.

