. 2017 May 30;125(5):057006. doi: 10.1289/EHP788

Figure 7.

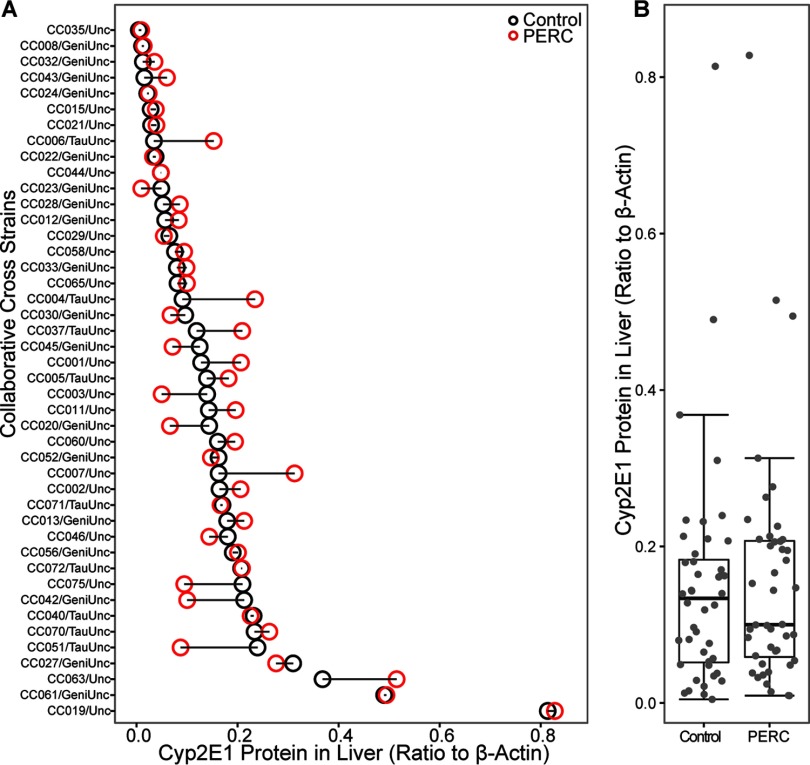
Panel A is a graphical representation indicating collaborative cross strains (y-axis) across concentration of CYP2E1 protein in liver (ratio to beta actin) (x-axis). Panel B is a box-and-whisker plot indicating concentration of CYP2E1 protein in liver (ratio to beta actin) (y-axis) for control and PERC-treated mice (x-axis).

Liver levels of CYP2E1 protein in vehicle- (black dot) and PERC- (1,000mg/kg, i.g., red dot) exposed Collaborative Cross mice 24 hr following a single intragastric gavage. A shows change in the individual strains that were ordered according to the values in vehicle-treated mice. B shows population average as box and whisker plots (see Figure 2 for the legend).