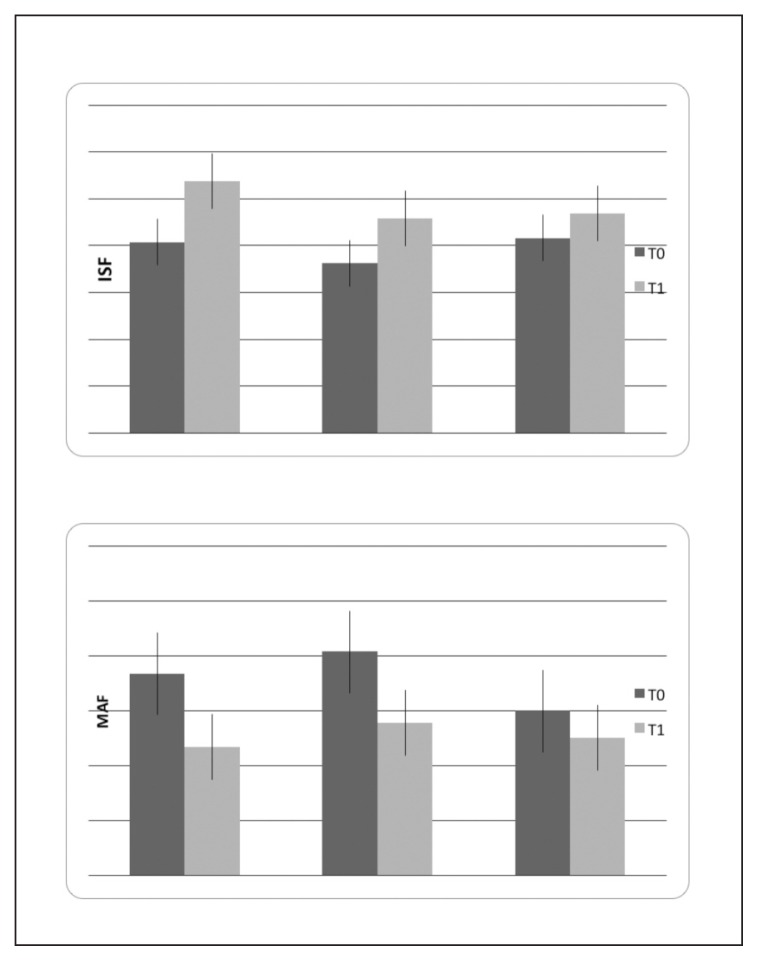
Figure 6.
Mean values and standard deviations of the Physical Component Summary (PCS) of SF-36 questionnaire and fatigue as measured by the MAF score in basal condition (T0) and after 3 months (T1) of biofeedback (N° 11), biofeedback + topiramate (N° 11) and topiramate (N° 10) treatments. The results of two-way ANOVA with phase as factor are reported: * p<0.001; *** p<0.0001. For the detailed statistical results, see Table I.

