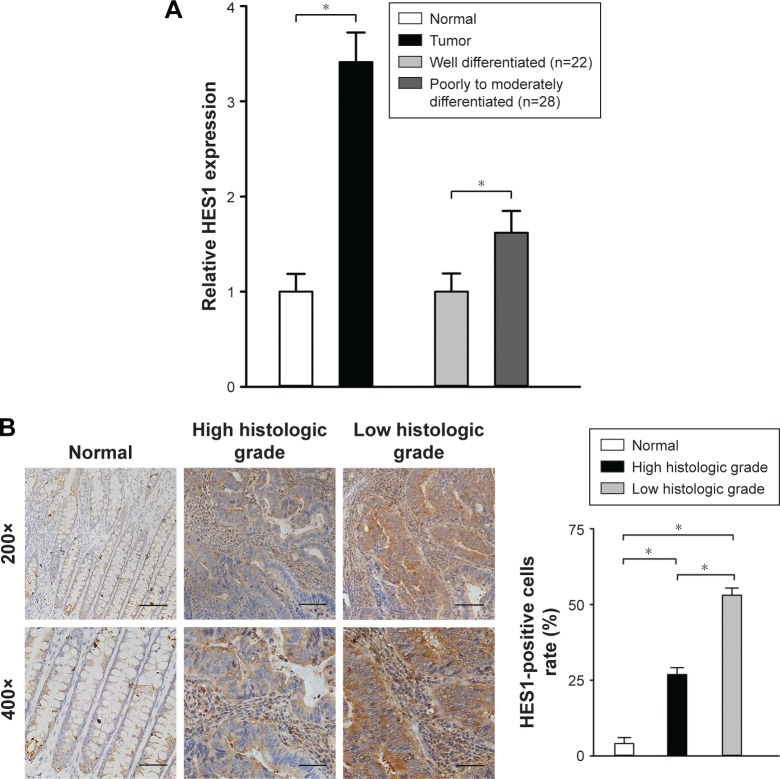
Figure 1.
HES1 expression in CRC tissues and adjacent normal samples.
Notes: (A) The expression of HES1 in 50 cases of CRC tissues and adjacent normal samples was determined using qRT-PCR. Data are presented as mean ± SD of three independent experiments. GAPDH was used as an internal control. *P<0.05, one-way ANOVA sections. (B) Immunohistochemical staining of HES1 in CRC tissue sections and adjacent normal samples. A quantitative graph for the percentage of HES1-positive cells is presented (five random fields, four sections per sample, *P<0.05, scale bars: 250 µm or 500 µm, two magnifications: 200× or 400×).
Abbreviations: ANOVA, analysis of variance; CRC, colorectal cancer; HES1, hairy/enhancer of split 1; qRT-PCR, quantitative real-time polymerase chain reaction.

