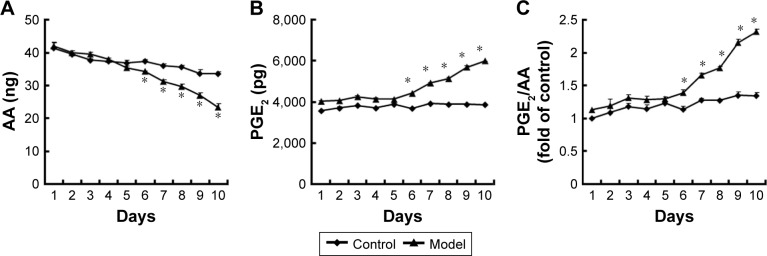
Figure 4.
The AA and PGE2 levels within the Transwell system.
Notes: (A and B) The AA and PGE2 levels of the supernatants collected each day from the Transwell system during the 10-day incubation were measured by ELISA. (C) The PGE2-to-AA ratios were calculated. Three independent experiments were carried out. The results are expressed as the mean ± SD, n=3, *P<0.05 compared with the control group.
Abbreviations: AA, arachidonic acid; PGE2, prostaglandin E2; ELISA, enzyme-linked immunosorbent assay; SD, standard deviation.

