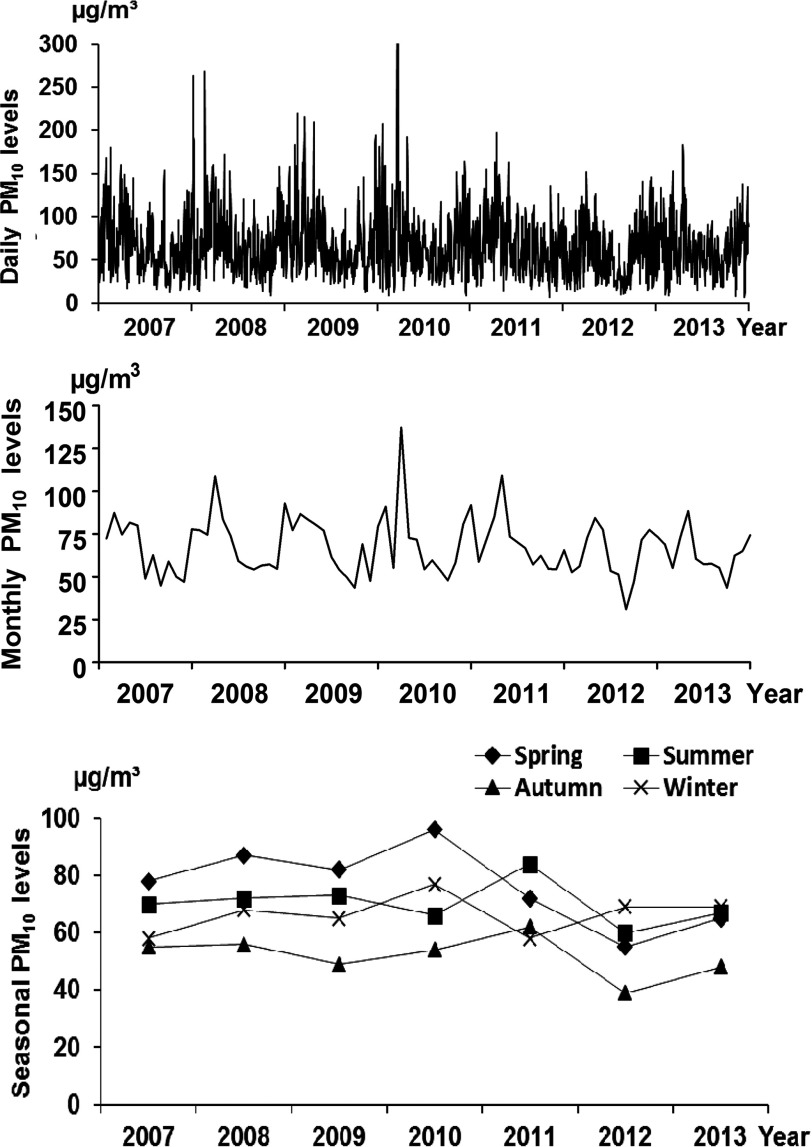
Figure 2.
levels in Fuzhou, China during 2007–2013. levels in Fuzhou varied dramatically, with daily levels averaged at . Daily levels exceeded 250 µg/m3 on 9 January () and 23 February (), 2008; on 21 March () and 23 (), 2010, peaking on 22 March (), 2010; and were as low as on 10 November 2011 and 16 December 2013. Levels that exceeded are not fully shown in the figure. The average monthly levels ranged between 56.1 and , and the seasonal levels were generally higher in the spring and lower in the autumn.

