
Figure 2.
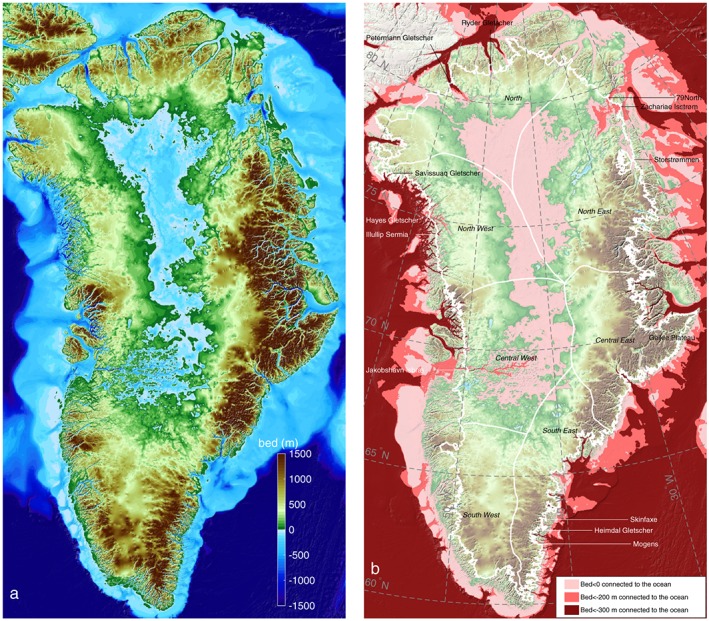
(a) BedMachine v3 bed topography (m), color coded between −1500 m and +1500 m with respect to mean sea level, with areas below sea level in blue and (b) regions below sea level (light pink) that are connected to the ocean and maintain a depth below 200 m (dark pink) and that are continuously deeper than 300 m below sea level (dark red). The thin white line shows the current ice sheet extent.