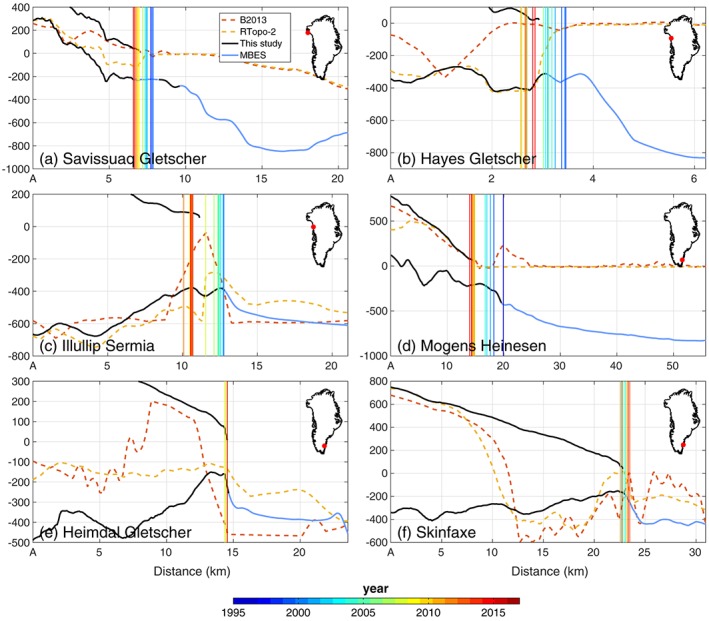
Figure 4.

Surface and bed topography along six profiles (see white dotted lines in Figure 3) from this study (solid black) and bed from B2013 (dotted red, Bamber et al., 2013) and RTopo‐2 (dotted yellow, Schaffer et al., 2016). Multibeam bathymetry data (MBES) are shown in blue. The vertical lines show the ice front position between 1995 and today.
