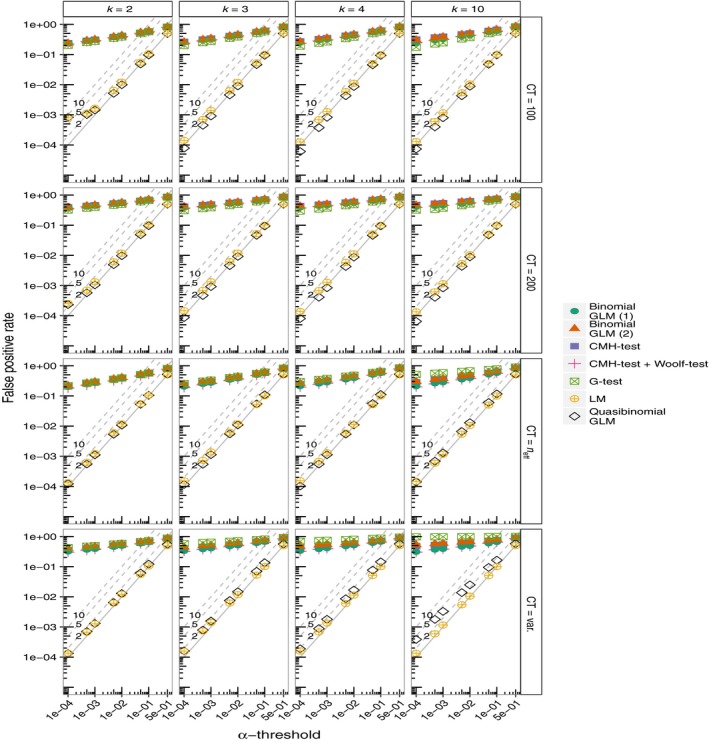
Figure 1.

The False Positive Rates (FPRs) at different levels of α for each simulation. Simulations are run for k = 2, 3, 4, and 10 replicated treatment lines with a neutral F ST of 0.2. Allele counts are allowed to vary freely (CT = var.), are fixed at 100 or 200 (CT = 100, CT = 200), or are scaled to neff (CT = n eff). Binomial GLMs are run with model structure (1) or (2) (see Methods). The diagonal lines labelled ‘2’, ‘5’, and ‘10’ represent 2, 5, and 10‐fold inflations of p‐values respectively. Pool size (N) is 100 diploid individuals, thus the number of independent chromosomes is 2N = 200
