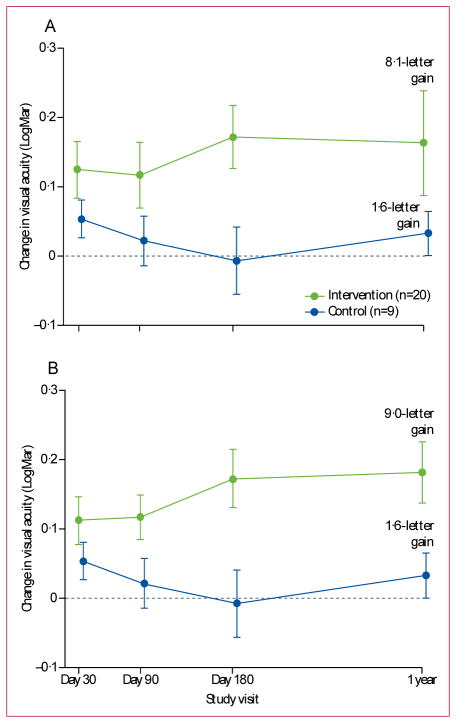
Figure 4. Mean change in BCVA in mITT population.
Mean change (LogMAR; baseline minus each study visit) in BCVA (both eyes) by treatment arm and study visit using (A) Holladay (post-hoc p=0·27) and (B) Lange (post-hoc p=0·0469) for off-chart acuities in the mITT population. Bars denote SEs. BCVA=best-corrected visual acuity. mITT=modified intention-to-treat.

