
Figure 1. MOR inhibition of NMDA-induced substance P release in spinal cord slices.
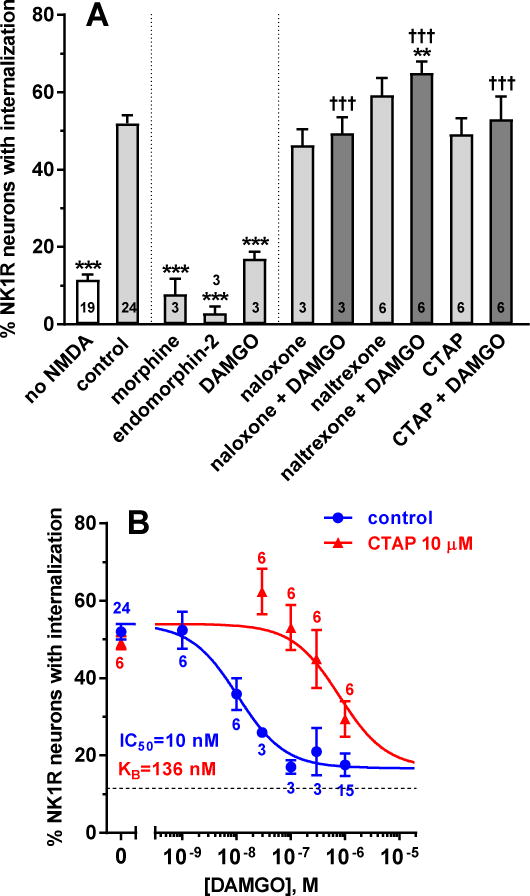
Spinal cord slices were incubated for 60 min with compounds and then for 2 min with NMDA and D-Ser (both 10 μM). The number of slices (n) is given inside the bars or next to the points. A. ‘no NMDA’: no compounds and no NMDA; ‘control’: no compounds followed by NMDA+D-Ser. Compounds were MOR agonists (1 μM morphine, 1 μM endomorphin-2, 100 nM DAMGO) and antagonists (10 μM naloxone, 10 μM naltrexone, 10 μM CTAP). ANOVA, p<0.0001. Holm-Sidak’s post-hoc tests: *** p<0.001, ** p<0.01 compared with control; ††† p<0.001 compared with DAMGO. B. DAMGO concentration-responses without (control) and with 10 μM CTAP. Data were analyzed by non-linear regression using the Gaddum-Schild model, with shared bottom and top parameters. Parameter values obtained were: IC50 (DAMGO) = 10 nM (95% CI 3.9 – 26.5 nM), KB (CTAP) = 136 nM (95% CI 43 – 393 nM), top = 54.0 ± 1.8%, bottom = 16.7 ± 2.7%, R2 = 0.64 (global fit).