
Figure 4. Confocal microscope images of lamina 1 neurons with and without NK1R internalization.
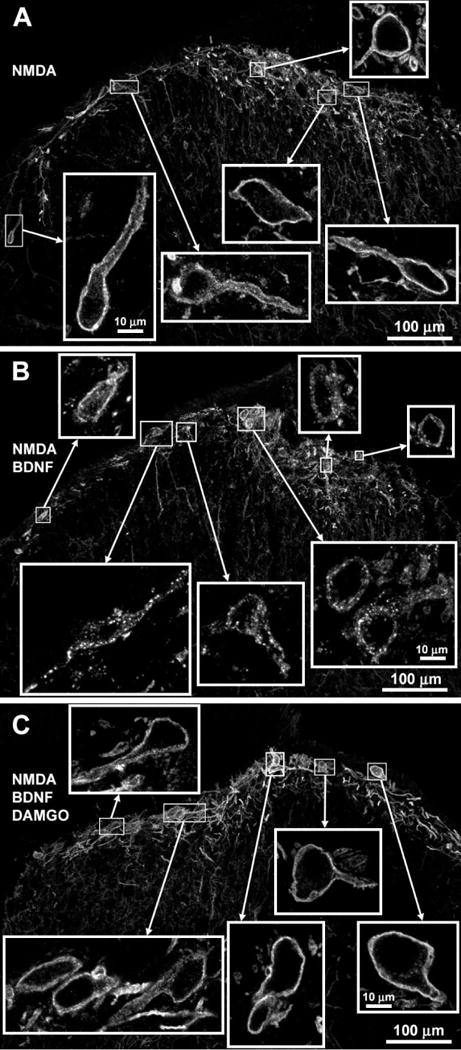
Images were taken from the L4 spinal segment of the rats used from the experiment in Fig. 3. Rats received three intrathecal injections using the following time line: 0 h - saline or BDNF (0.3 μg); 3 h - saline or DAMGO (3 nmol); 4 h - NMDA + D-Ser (10 nmol each). A. Rat injected with saline-saline-NMDA; there was no NK1R internalization. B. Rat injected with BDNF-saline-NMDA; NK1R internalization is clear in 5 out of 7 cells. C. Rat injected with BDNF-DAMGO-NMDA; there was no NK1R internalization. Images are 10 optical sections taken with a 20× objective (main panels, voxel size 692 × 692 × 854 nm, scale bar 100 μm) or a 63× objective (insets, voxel size 132 × 132 × 377 nm, scale bar 10 μm).