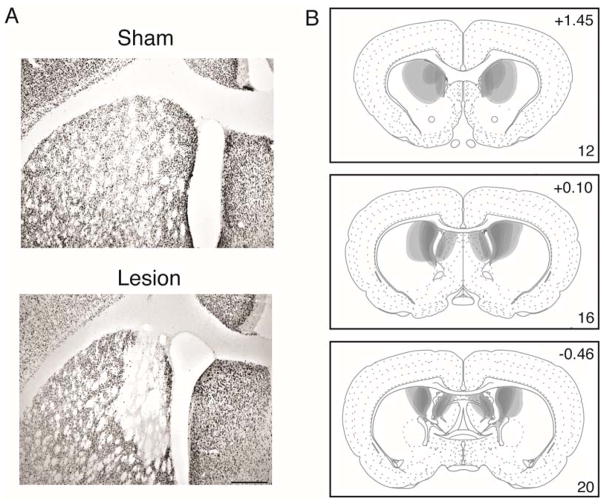
Figure 1.
(A) NeuN-stained sections showing typical sham (top) and NMDA excitotoxic lesions (bottom) of the DMS. Scale bar = 200μm (B) Lesion extent of all included subjects, drawn with 50% opacity in Adobe Illustrator CS4. Numbers in the top right refer to distance in mm from Bregma, and those in the bottom right refer to the corresponding plate number in Swanson (2004), adapted from Swanson, L.W. (2004) Brain Maps: Structure of the Rat Brain, 3rd edition.

