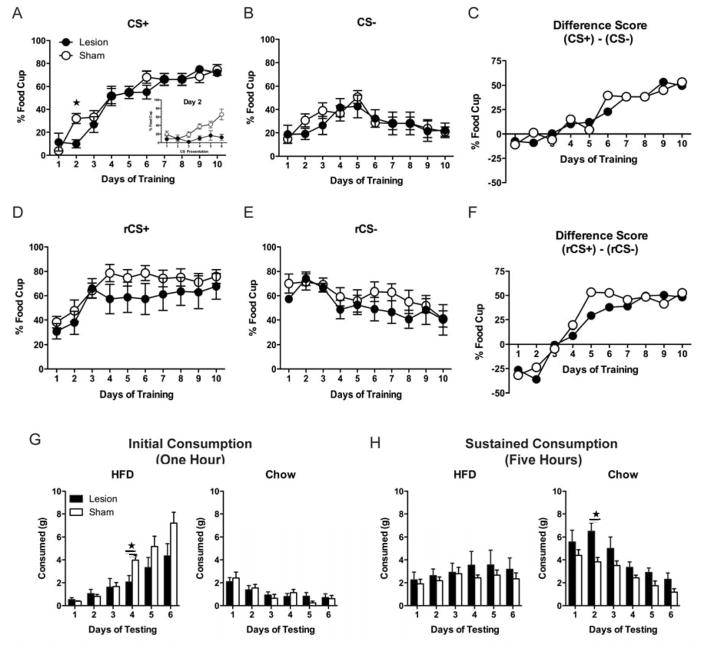
Figure 2.
Percentage of time (mean ± SEM) rats expressed food-cup behavior during CS+ presentations across training days (Day 2 inset) (A), during CS− presentations across days (B), and expressed as a difference score (CS+ − CS−) (C). Percentage of time (mean ± SEM) rats expressed food-cup behavior during Reversal to rCS+ (previously CS−) (D), to rCS− (previously CS+) (E), and expressed as a difference score (rCS+ − rCS−) (F). Consumption (mean + SEM) of chow and HFD across days of testing. Consumption was measured after 1 hour (G) and then after an additional 5 hours (H). ★ denotes p < 0.05.

