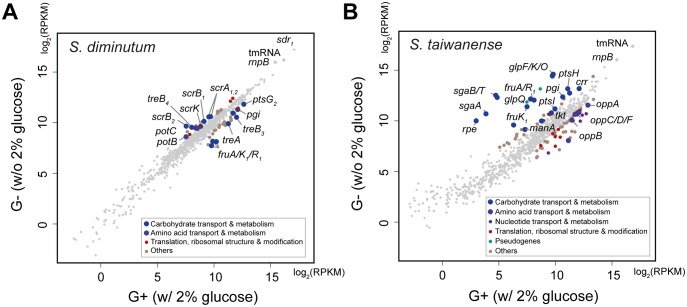
Fig. 4.
—Gene expression levels in response to glucose availability. (A) Spiroplasma diminutum. (B) Spiroplasma taiwanense. The expression levels are measured in RPKM mapped reads (log2-transformed). All protein-coding genes and two highly expressed noncoding genes (i.e., tmRNA and rnpB) are shown. The genes exhibiting significant differential expressions between the two growth conditions are color-coded based on their COG functional category assignments. The remaining genes are represented by gray dots.

