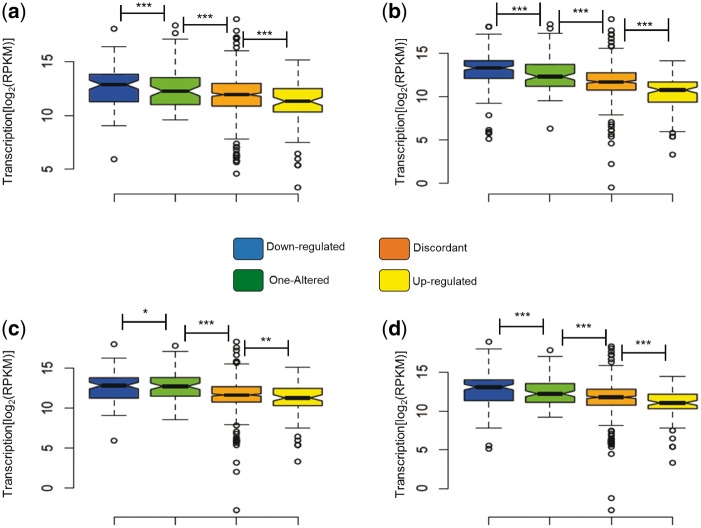
Figure 5.
The expression level of duplicates correlated with their patterns of expression divergence. Expression was measured as the logarithmic transformation of the Reads Per billion (RPKM). Significant differences in the expression levels of gene sets are indicated as *, ** and ***, referring to probabilities of P < 0.05, P < 0.01 and P < 10−6, using a Wilcoxon rank test. (a) Expression under ethanol stress, (b) expression under glycerol stress, (c) expression under lactate stress and (d) expression under oxidative stress.

