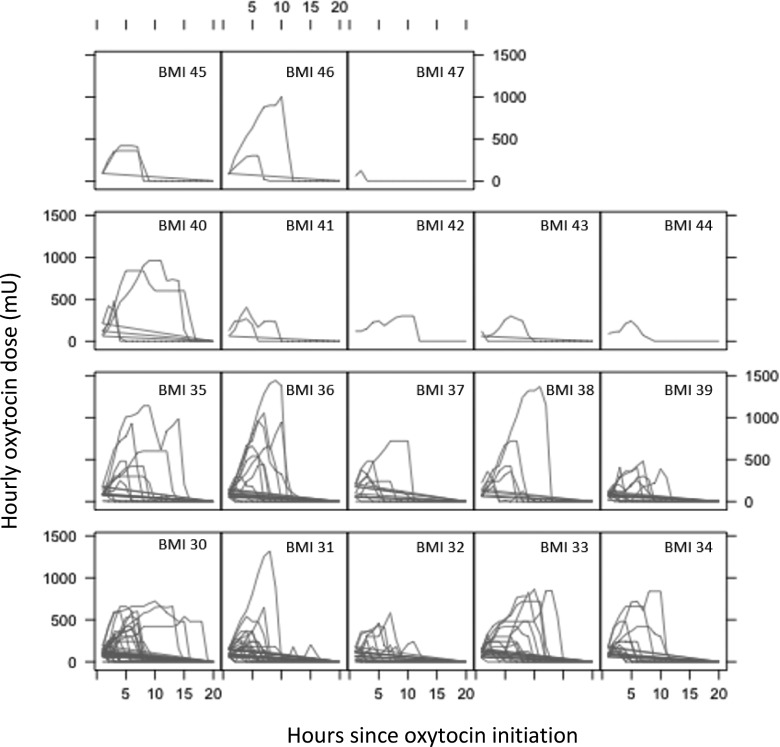
Figure 3.
Plot of hourly oxytocin dose trajectories by maternal body mass index (BMI) grouping, hour of infusion for groups defined by maternal delivery BMI (kg/m2). For each group of women separated into boxes by their integer BMI values at delivery, lines designate the hourly oxytocin dose for each hour of labor augmentation. The graphs demonstrate longer periods of augmentation (longer lines) and higher hourly oxytocin doses (higher peaks in the lines) as maternal delivery BMI value increases.

