
Figure 2.
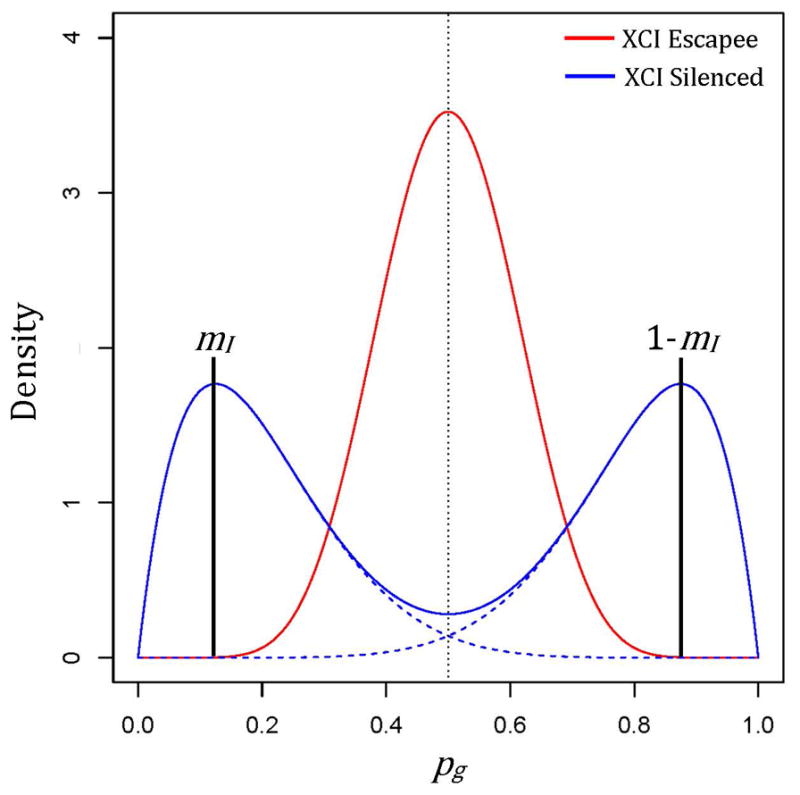
Depiction of beta-mixtures corresponding to underlying allelic expression ratios (AERs) for genes escaping XCI (red) or silenced by XCI (blue), with degree of skewness (mI) indicated by vertical black lines at the respective modes of the component symmetric beta distributions (dashed blue lines).