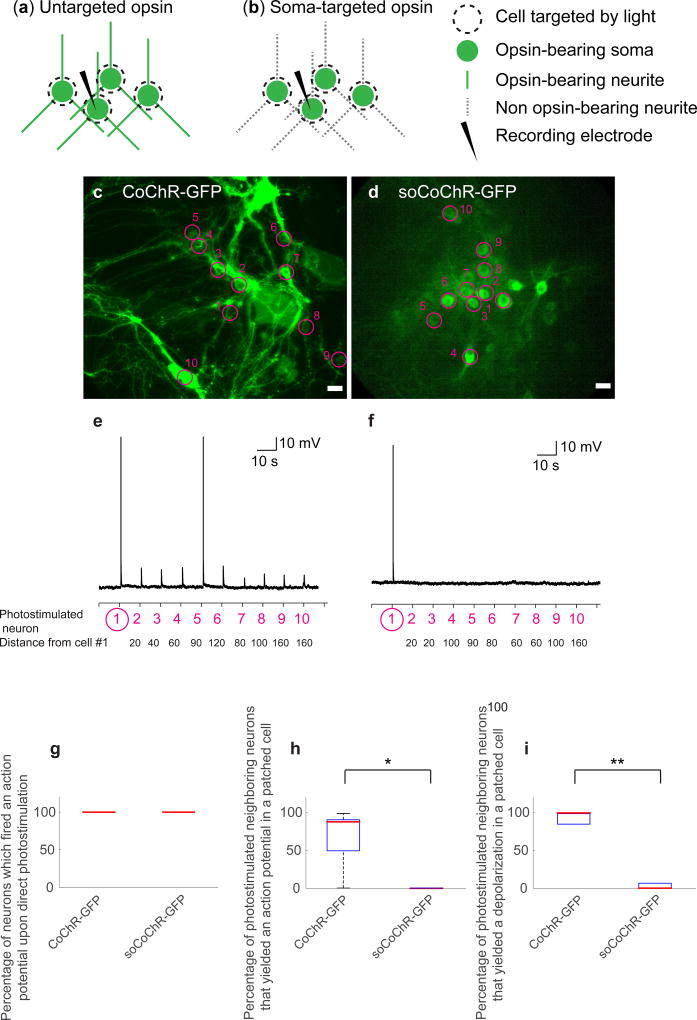
Figure 2. Zero-spike crosstalk single cell optogenetic control of cultured neurons with one-photon illumination.
(a,b) Schematic of the experiment. Cultured hippocampal neurons two weeks after transduction with AAV8-Syn-CoChR-GFP (untargeted CoChR, a) or AAV8-Syn-soCoChR-GFP (somatic CoChR, b). One cell in the field of view was patched (current clamp). The patched cell along with 9 neighboring cells were photo-stimulated using a digital micromirror device (DMD) consecutively. (c) Cultured hippocampal neurons expressing CoChR-GFP; regions of stimulation are highlighted by magenta circles. Numbers denote the order of stimulation. Scale bar: 20 µm. (d) As in c, but for soCoChR-GFP. (e) Representative current-clamp recording for a cultured hippocampal neuron expressing CoChR-GFP. Cells were photostimulated sequentially using the DMD (470 nm, 40.7 mW/mm2, 1 ms light pulse). The order of the photo-stimulation, as indicated by the numbers in c, is given on the x-axis. The patched cell is numbered 1. The distance of cells 2–9 from the patched cell is given below each cell number, in microns. (f) As in e, but for soCoChR-GFP. (g) Box-and-whiskers plot showing the percentage of cultured hippocampal neurons which fired an action potential (AP) upon direct photostimulation, using light pulses as above (n = 5 cells from 4 cultures for CoChR-GFP; n = 5 cells from 5 cultures for soCoChR-GFP). Red line denotes the median. (h) Box-and-whiskers plot showing, averaged across all patched neurons, the percentage of photostimulated neighboring cells that yielded an AP in each patched cell (n = 5 cells from 4 cultures for CoChR-GFP; n = 5 cells from 5 cultures for soCoChR-GFP). Red line denotes the median. Top and bottom edges of the box indicate the 75th and 25th percentiles, respectively. Top and bottom whiskers indicate the highest and lowest values respectively. *P=0.0476, Wilcoxon rank sum test; Supplementary Table 3 for full statistics. (i) Box-and-whiskers plot showing, averaged across all patched neurons, the percentage of photostimulated neighboring cells that yielded a depolarization in each patched cell (n = 5 cells, in 4 cultures for CoChR-GFP; n = 5 cells, in 5 cultures for soCoChR-GFP). Red line denotes the median. Top and bottom edges of the box indicate the 75th and 25th percentiles, respectively. **P=0.0079, Wilcoxon rank sum test; Supplementary Table 3 for full statistics.

