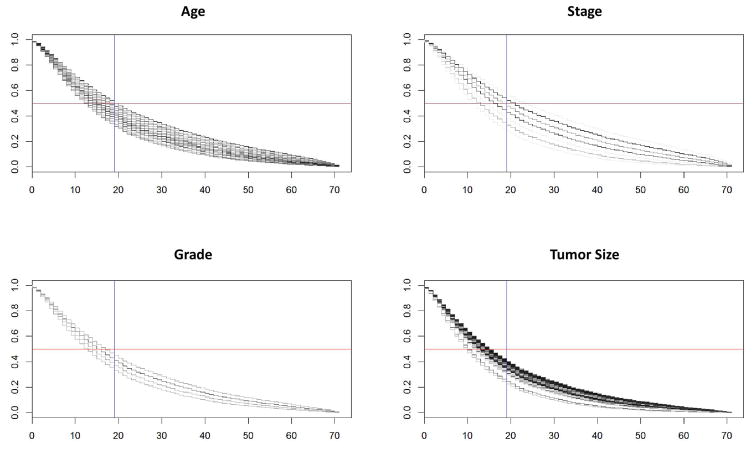
Figure 3.
Cox proportional hazards model of survivability for the validation data across the Age, Stage, Grade and Tumor Size groupings. Each frame has multiple lines showing how the probability of survivability decreases for each value, e.g., Stage shows lines for stages 0, IA, IB, IIA, etc. The x-axis is months of survival and the y-axis is the Cox-assigned probability of survival to that time for any given line. Horizontal reference line denotes 50% survivability rate and vertical reference line denotes the ~19 month mean survival time prediction (Table 2).

