
Figure 2. The Ska1 microtubule binding domain uses multiple distinct surfaces to interact with tubulin.
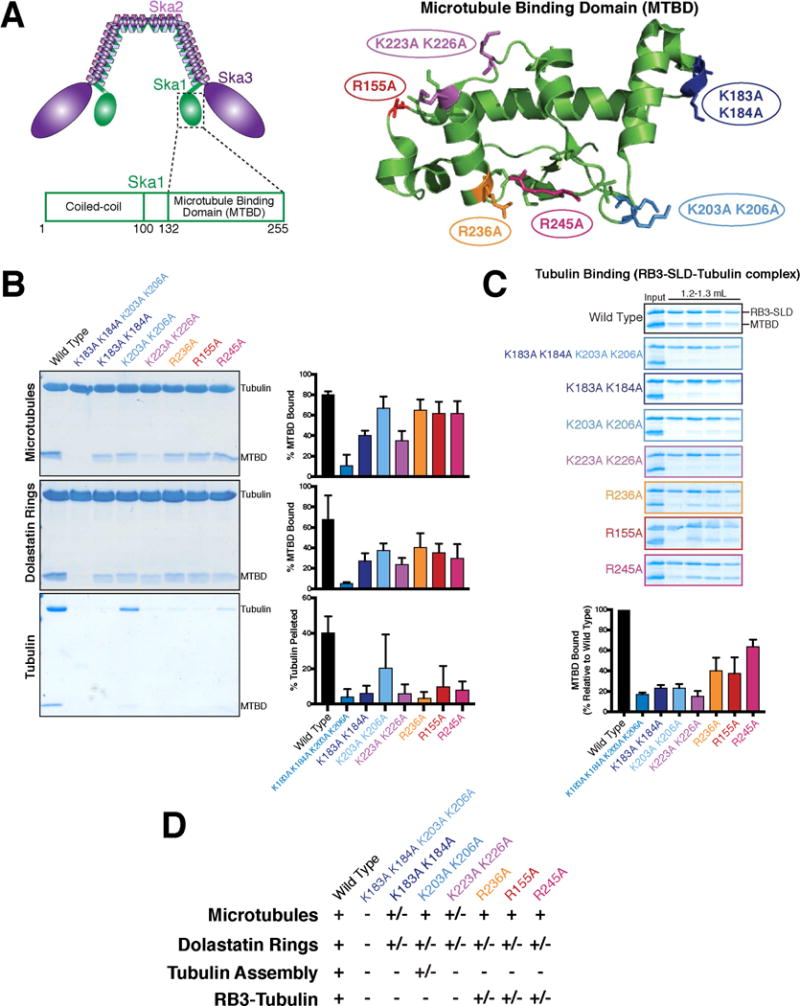
A. Left: Schematic of the human Ska1 complex highlighting the location of the Ska1 microtubule binding domain within the complex, and within the Ska1 protein. Right: Structure of the human Ska1 microtubule binding domain (4C9Y.pdb) [12] showing the locations of the indicated residues targeted for mutational analysis. B. Coomassie-stained gels showing the pellet fractions from representative co-sedimentation assays for the binding of the indicated Ska1 microtubule binding domain mutants to either microtubule polymers, dolastatin-induced rings, or soluble tubulin dimer. For microtubules and dolastatin-induced rings, quantifications indicate the percentage of MTBD bound to the substrate for 2 experiments, with the mean + SD shown. For tubulin, the quantification indicates the percentage of tubulin in the pellet for 7 independent experiments, with the mean + SD shown. See Figure S2A for the Coomassie-stained gels of the supernatant fractions. C. Coomassie-stained gels of the size exclusion chromatography fractions for binding of the Ska1 MTBD and mutants to an RB3-SLD-tubulin complex. The gel for wild type MTBD is duplicated from Figure 1F. RB3-SLD-tubulin peak fractions (see Figure 1F) are shown for each of the Ska1 MTBD mutants. Quantifications indicate the amount of Ska1 MTBD co-eluting with RB3-SLD relative to wild type for 2 experiments, with the mean + SD shown. All mutants show reduced or eliminated binding to RB3-SLD-tubulin. Also see Figure S2B. D. Table summarizing the binding data from this figure.