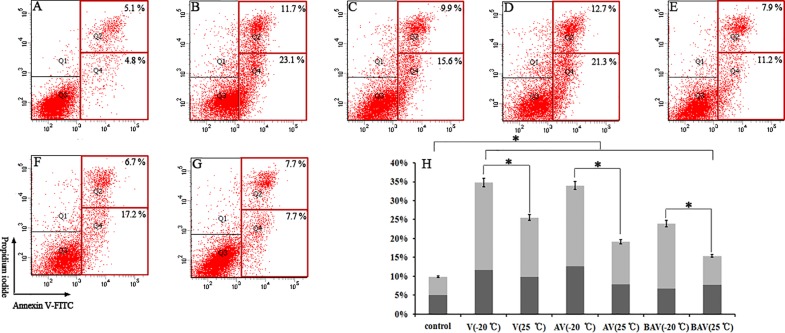
Fig 4. Apoptosis was measured by flow cytometry through Annexin V-FITC and PI staining.
Representative plots from one set of Annexin V-FITC flow cytometry and PI staining experiments performed in triplicate are shown. Early apoptotic cells (Annexin-V+ and PI-) are shown in the lower right quadrant, and late apoptotic cells (Annexin-V+ and PI+) are shown in the upper right quadrant. The percentages of apoptotic cells are indicated as Annexin-V+ cells and are shown as the means ± the SD from three independent experiments. (A—G) Results from the (A) control, (B) V (-20°C), (C) V (25°C for 7 days), (D) AV (-20°C), (E) AV (25°C for 7 days), (F) BAV (-20°C) and (G) BAV (25°C for 7 days) groups. (H) The data are presented as the means ± the SD from three separate experiments (* p < 0.05).

