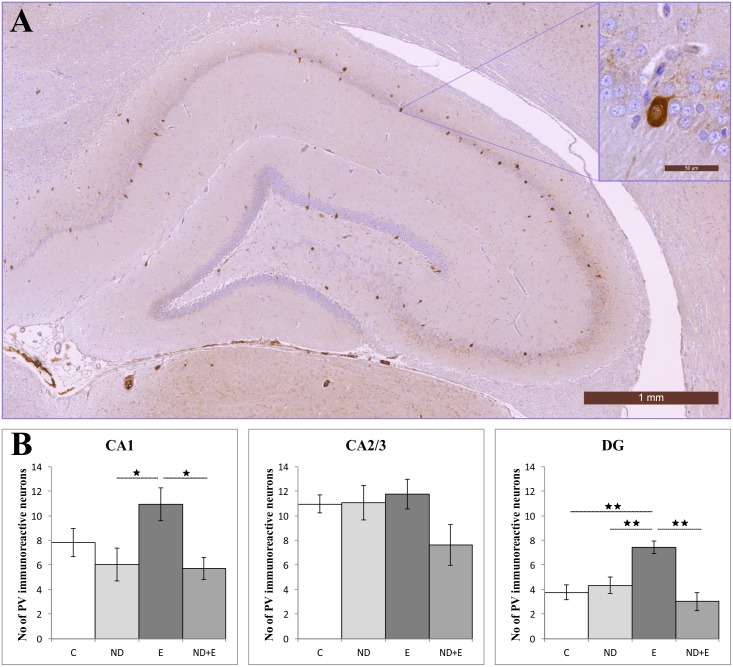
Fig 4. Immunohistochemical expression of PV positive interneurons in the rat hippocampus.
(A) Distribution in the control group. (B) Number of PV immunoreactive neurons in hippocampal regions. C—control group (n = 8), ND—nandrolone decanoate group (n = 12), E—exercise group (n = 11), ND+E—nandrolone decanoate plus exercise group (n = 9). (Mean ± SEM, * denotes a significant difference p<0.05, ** denotes significant difference p<0.01, One-way ANOVA, Scheffe’s post hoc test).

