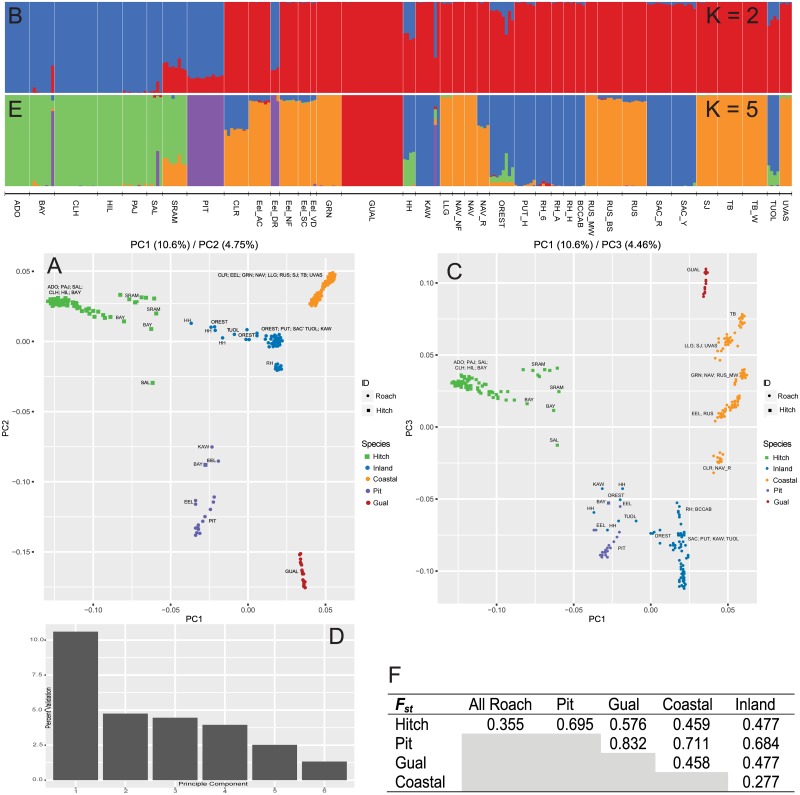
Fig 2. Summary genomic analyses for entire dataset.
Shown is a principal component analysis for PC1 x PC2 (A) and PC1 x PC3 (C), with percent variation shown over six principal components (D). Admixture analyses on the same dataset were conducted for the two strongest supported clusters (K), two (B) and five (E), according to the Evanno method [27] shown in S1 Fig. Final pairwise estimates of FST between identified clusters (K = 5) are provided. All colors are consistent across subfigures, except (A) where blue represents Lavinia and red represents Hesperoleucus. Nomenclature is consistent with abbreviations in S1 Table.

