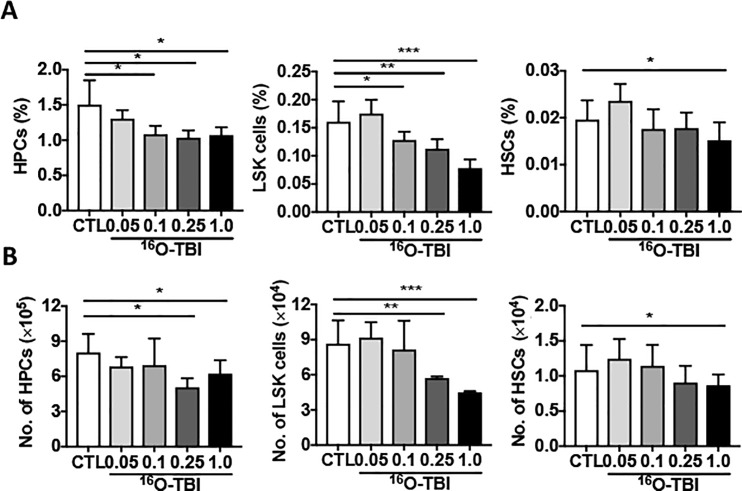
Fig 2. 16O TBI caused reductions in percentages and numbers of HPCs, LSK cells and HSCs at three months after exposure.
HPCs (Lin-Sca1-c-kit- cells), LSK cells (Lin-Sca1+c-kit+cells) and HSCs (Lin-Sca1+c-kit+CD150+CD48- cells) in BM were measured three months after 0.05 Gy, 0.1 Gy, 0.25 Gy, and 1.0 Gy 16O TBI. The frequencies (panel A) and numbers (panel B) of HPCs, LSK cells and HSCs from total bone marrow cells in each mouse are presented as means ±SD (n = 5). The statistical significance for differences between the control group (CTL) and each of the irradiated groups is indicated by asterisks. *p<0.05, **p<0.01, ***p<0.001 as determined by one-way ANOVA, followed by Tukey-Kramer test for individual comparisons.

