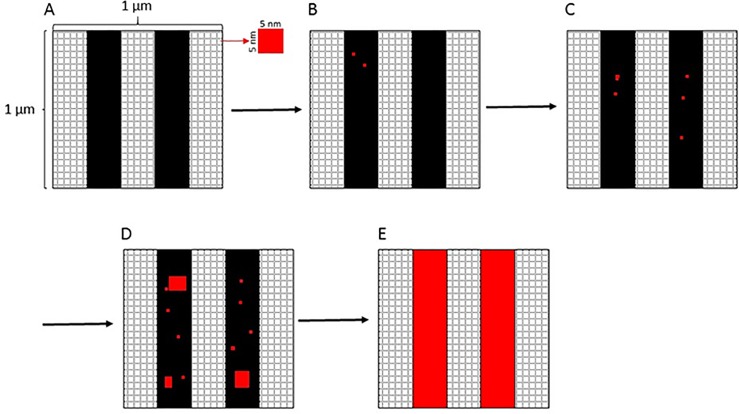
Fig 1. Schematic description of the glucan unmasking model.
(A) Masked glucan on C. albicans cell walls was represented as stripes (black) of a specified width in pixels and covering a specified fraction of the total simulation area (white grid space). The stripes model the presence of fibrillar structures of insoluble glucan in the C. albicans cell wall. Each pixel represents a 5 nm x 5 nm area in the total square simulation space of 1 um2. The glucan unmasking model proceeds by selecting a single pixel at each iteration (black masked glucan or white glucan free) and changing its state. As pixels representing glucan are unmasked, they change their color to red. (B-D) Pixels are chosen for glucan unmasking at each iteration of the simulation, either in a random (Pedge = 0) or an edge biased (Pedge>0) manner. If Pedge>0, then Pedge determines the probability that a pixel will be chosen from the boundary pixels surrounding existing exposures as opposed to a pixel chosen randomly from the surface. (E) The simulation space is 200 x 200 pixels, so after 40,000 iterations all pixels have been selected and all masked glucan has been exposed.

