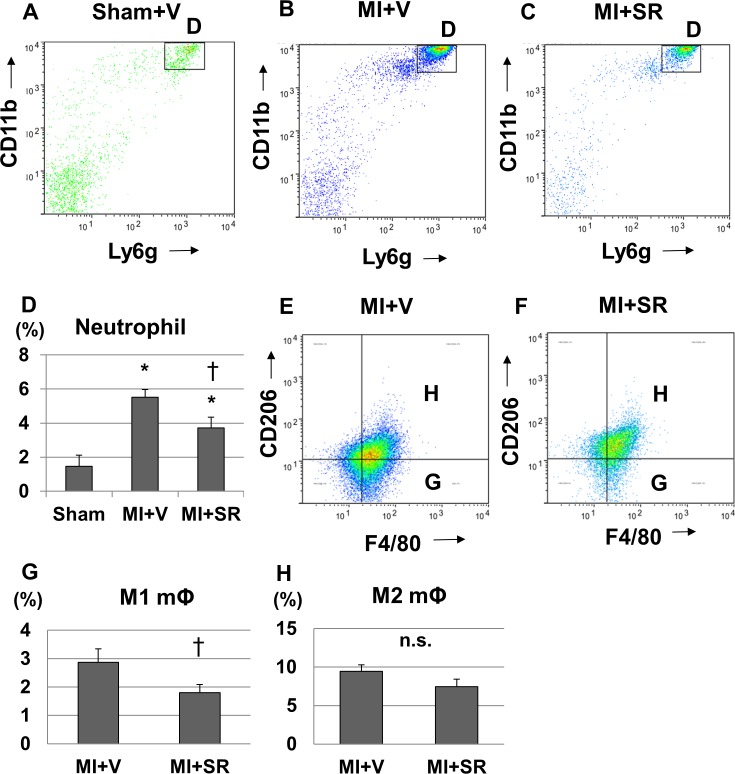
Fig 7. Flow cytometric analysis.
Flow cytometric analysis of the infiltration of inflammatory cells into the infarct and border areas at 1 day after myocardial infarction (MI) (n = 5 in each group). The representative plots (gated on CD45+ and expanded into Ly6G and CD11b) of (A) Sham+V, (B) MI+V, and (C) MI+SR9009 are shown. (D) The percentage of CD45+CD11b+Ly6G+ cells (neutrophils) to CD45+ cells was significantly lower in MI+SR than in MI+V, suggesting that neutrophil infiltration was reduced by SR9009 treatment. Flow cytometric analysis of M1/M2 macrophage infiltration into the infarct and border areas at 5 days after MI (n = 5 in each group). The representative plots (gated on CD11b and expanded into F4/80 and CD206) of (E) MI+V, and (F) MI+SR9009 are shown. (G) The percentage of F4/80+CD206- cells to live cells was significantly lower in MI+SR than in MI+V although the percentage of F4/80+CD206+ cells to live cells was not significantly different between MI+V and MI+SR, suggesting that proinflammatory M1 macrophage infiltration was reduced by SR9009 treatment. The bar graphs show the group mean±SEM. *p<0.05 vs Sham+V; †p<0.05 vs MI+V.

