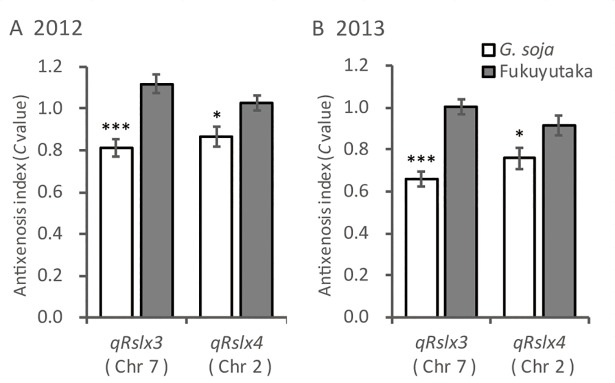
Fig 3.
Differences in the mean antixenosis (C) values of the Glycine soja × ‘Fukuyutaka’-derived recombinant-inbred lines for each genotype in (A) 2012 and (B) 2013. Each genotype of qRslx3 and qRslx4 is represented by markers in the quantitative trait loci regions (Table 1). Values represent means ± standard errors. *, *** Significant at the 0.05 and 0.001 levels, respectively.

