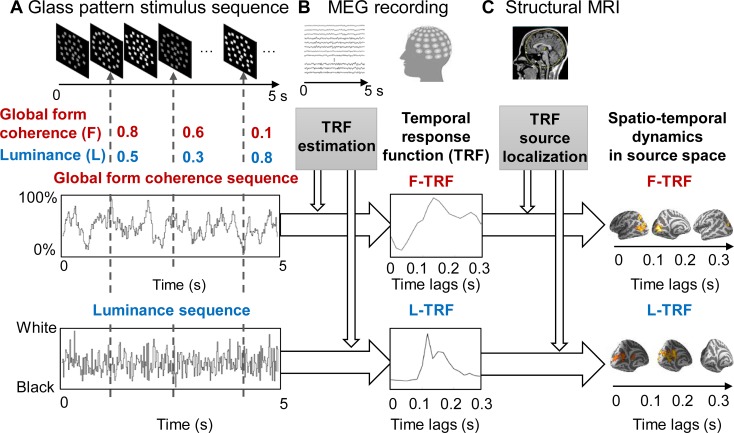
Fig 1. Experimental paradigm and illustration of the TRF approach.
(A) We recorded 275-channel, whole-head magnetoencephalography signals from subjects who were viewing a 5-s circular glass pattern stimulus sequence in each trial. The global F (red) and the L (blue) of the glass pattern stimuli were continuously modulated according to 2 independent and randomly generated 5-s temporal sequences (the global F sequence and the L sequence) throughout each trial. (B) The F-TRF (red) and L-TRF (blue) responses were then calculated from the same MEG recordings based on the corresponding stimulus temporal sequences for each of the 275 MEG channels in each subject by using a linear least-squares approach. (C) Spatiotemporal dynamics of the F-TRF and L-TRF responses in source space (dSPM method for source localization) was calculated in combination with individual anatomical MRI scans. dSPM, dynamic statistical parametric mapping; F, form coherence; F-TRF, form coherence TRF; L, luminance; L-TRF, luminance TRF; MEG, magnetoencephalography; TRF, temporal response function.

