
Supplementary Fig. 5.
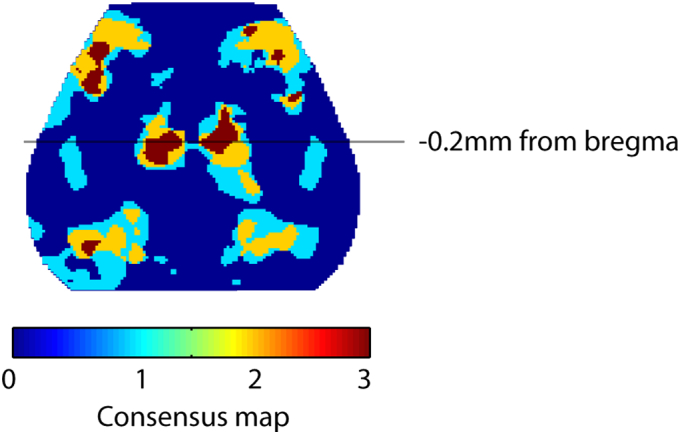
Consensus difference map for Stroke EE vs Stoke STD connectivity measures. Difference maps for homotopic FC, interhemispheric- and intrahemispheric node degree were thresholded at an uncorrected p-value of 0.05 and overlaid on the same image. Connectivity differences in posterior motor regions were shared across all 3 methods in both hemispheres. The line at − 0.2 mm from bregma marks the approximate location for histological quantification of PV cell count in Fig. 7.