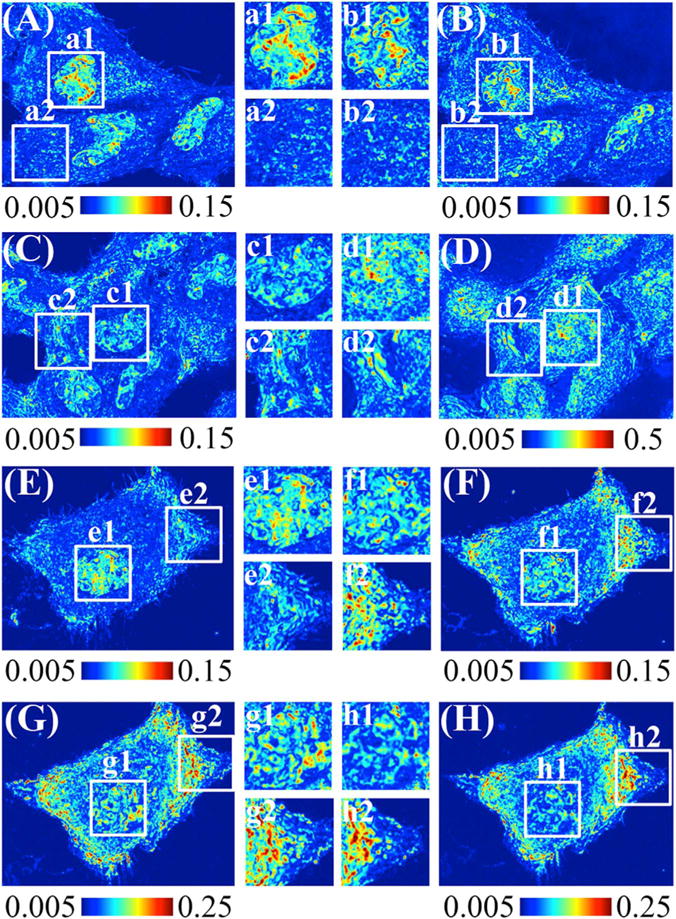
Fig. 1.

PWS measurement of Hela Cells at different stages of fixation. The higher value (redder) indicates higher level of mass-density heterogeneity. (A) (C) (E) show live Hela cells without any treatment. (B) After 4% PFA fixation. (D) After 95% EtOH fixation. (F)–(H), after 2.5% GA and 2% FA, after 1% OsO4, and after serial ethanol dehydration. Color scale: (A) (B) (E) (F) from 0.005 to 0.15, (D) from 0.005 to 0.5, (G) and (H) from 0.05 to 0.25. The inset squares are higher magnification images of nucleus and cytoplasm region.
