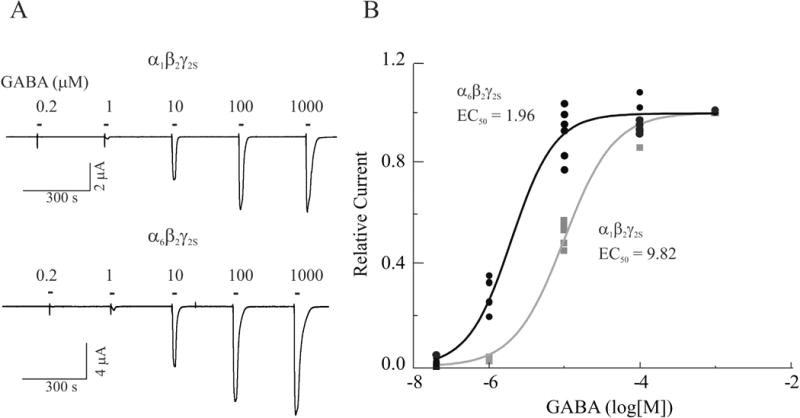
Figure 2.

Differential sensitivity of recombinant α1β2γ2S and α6β2γ2S receptors to GABA. A, Whole cell currents recorded from representative oocytes expressing α1β2γ2S (Top) and α6β2γ2S (Bottom) in response to 0.2–1000 μM GABA. B, Concentration-dependent response curves were generated by nonlinear regression fit of normalized GABA-evoked currents recorded from oocytes expressing α1β2γ2S (Black) and α6β2γ2S (Grey) receptors. The peak current evoked by each concentration of GABA is normalized to that evoked by 0.2 μM GABA. Each value is a representative example of 5 – 6 individual experiments.
