
Fig. 5.
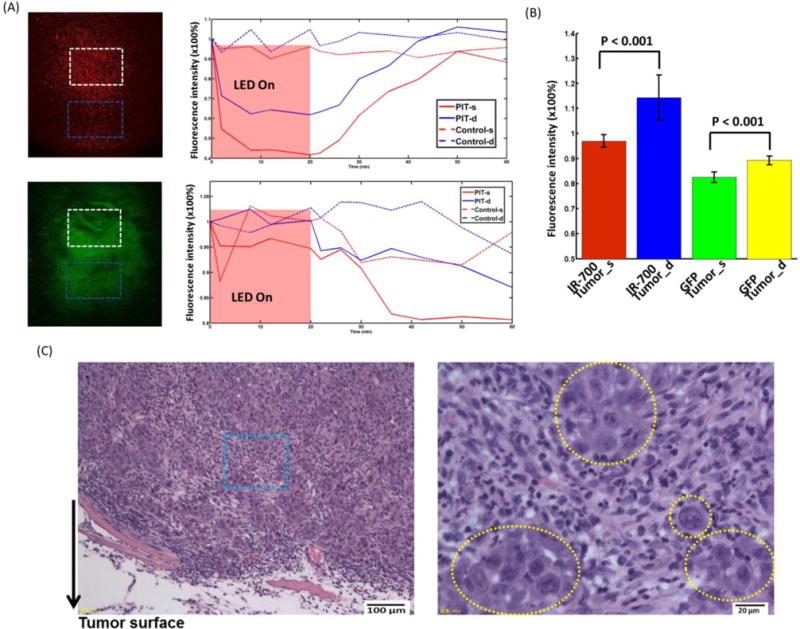
(A) Representative normalized average IR700 fluorescence intensity (upper) and GFP intensity (lower) of tumor surface and deep tumor during and after PIT treatment compared with control mouse. (B) Left: IR700 fluorescence recovery value of tumor surface and deep tumor. Deep tumor showed significantly higher fluorescence recovery intensity value than that of the tumor surface (n=5). Right: GFP intensity of tumor surface and deep tumor. The tumor surface showed a significantly larger GFP fluorescence decrease than that of the deep tumor (n=5). (C) Histological specimens of A431 tumors from the PIT-treated group. The image on the right side is the zoomed-in image from the blue square in the left image. The yellow dashed circles indicate undamaged cells. Overall, there was less damage compared to the two-channel fiber bundle results.