
Figure 3.
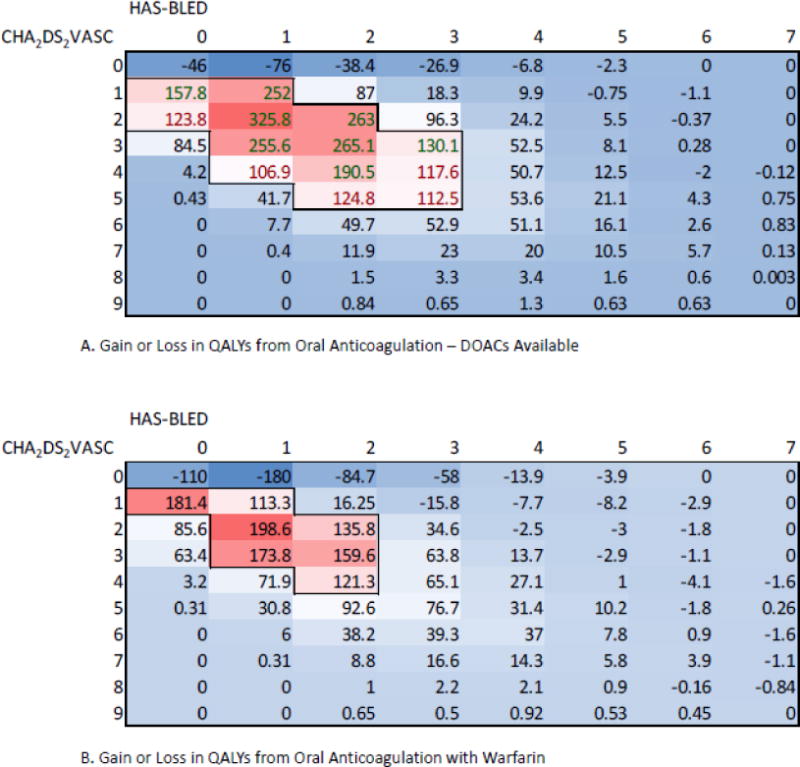
Heatmap showing gain or loss in QALYs for the UC Health AF cohort stratified by CHA2DS2VASc and HAS-BLED scores. More intense red colors correspond to regions of larger gain, while lighter blue colors correspond to regions of lesser gain. All gains or losses in both panels are relative to no thromboprophylaxis.
Panel A – results when DOACs are available options for anticoagulant therapy. Largest gains are within the region where CHA2DS2VASc scores are between one and five and HAS-BLED scores are between zero and three.
Panel B – results when warfarin is the only available option for oral anticoagulant therapy. Region of large population gains is smaller than in panel A, when DOACs are available. Largest gains are within the smaller region where CHA2DS2VASc scores are between one and four and HAS-BLED scores are between zero and two. In addition, the magnitude of the gains in even the most optimistic cells is smaller than in panel A.