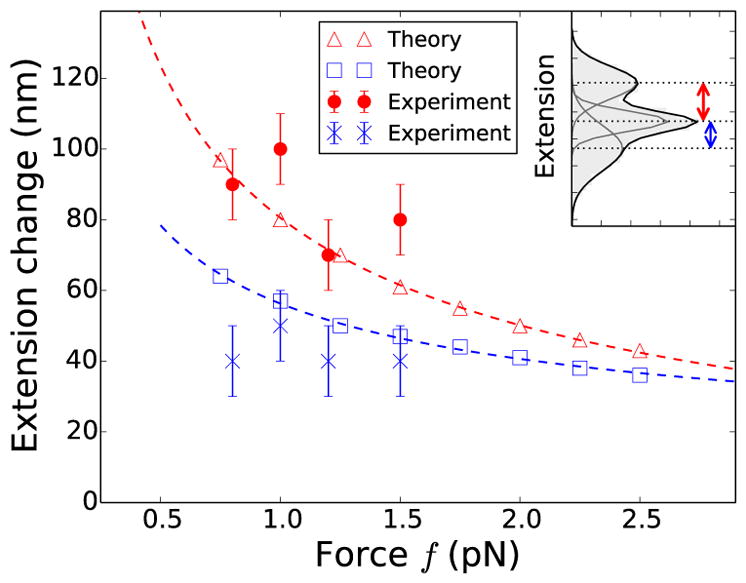
FIG. 3.

(color online) Comparison of theoretically predicted change in extension upon nucleation of the first (red open triangles) and the second (blue open squares) plectoneme domain with experimental observations. Red points and blue cross marks represent the difference in extension between successive peaks (inset) in the experimental best-fit histograms, where the second jump (blue cross markers) is measured one unit catenation after the first jump (red points). The error bars represent binning error. The red and blue dashed lines show the expected f−1/2 power law (Eq. 1), best-fit to red open triangles and blue open squares respectively.
