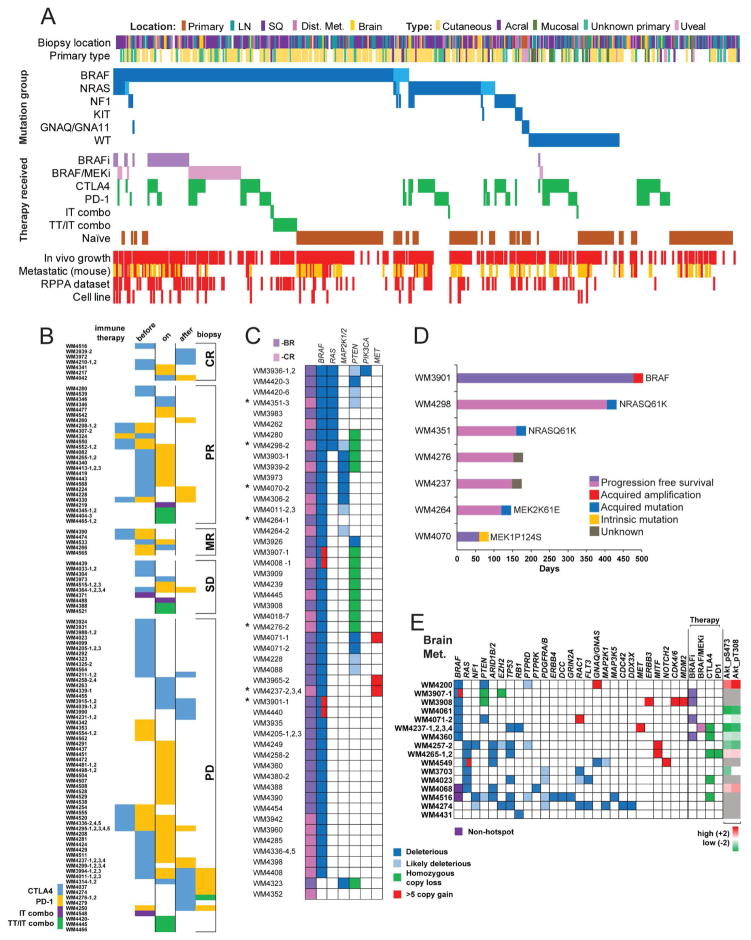
Figure 3. Overview of PDX collection, immune therapy, targeted therapy resistant, and brain metastasis derived subsets.
(A) All PDX and live frozen tissue samples sorted by driver mutations and therapy received by the patients. Driver mutations are dark blue for hotspot and light blue for non-hotspot mutation. PDX from patients progressed on targeted therapies are shades of purple, patients treated with immune checkpoint inhibitors are green: sequential, combination CTLA4+PD-1 (IT combo), or combination with BRAF inhibition (TT/IT combo). Red indicates in vivo growth, presence of RPPA data, or a corresponding cell line. Samples that spontaneously metastasize to lungs in mice are red, yellow indicates no lung metastasis, white was not assessed. (B) Patients were treated with CTLA4 or PD-1 blocking therapy before, during, or after biopsy. Combination therapies are indicated. PDX are sorted by best response in the patients. Additional PDX with unknown response are not shown. (C) Genetic data of BRAF (−BR) and BRAF/MEK (−CR) inhibitor-resistant PDX. Deleterious and likely deleterious mutations, homozygous loss, and high copy number gains (>5) are shown. Numbering after dash (1–4) indicate additional PDX available from the same patient. Asterisks indicate resistant PDX with available patient matched pre-therapy derived PDX.(D) Patient matched pre- and post-therapy PDX models. Progression free survival of patients treated with BRAF or BRAF/MEK inhibitor (x-axis). Columns are labeled with putative resistance mechanisms. (E) Genetic profile and therapy received of 22 PDX with available sequencing data out of 31 total brain metastasis PDX. Deleterious and likely deleterious mutations, homozygous loss, and high copy number gains (>5) are shown. As an indication of PI3K pathway activation status RPPA levels of phosphorylated AKT are shown.

