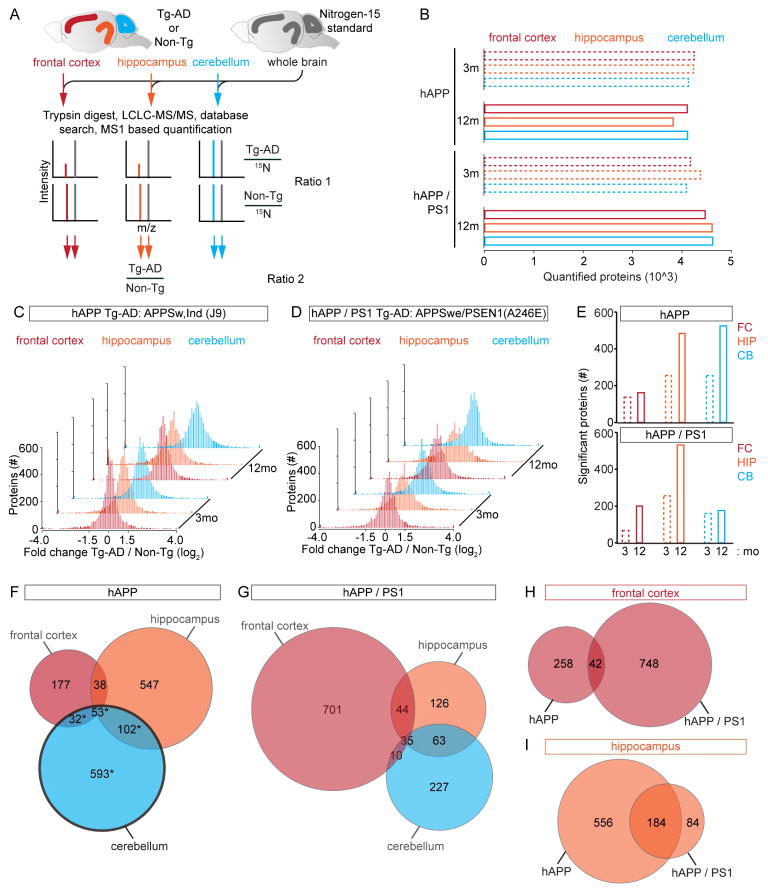
Figure 1.
Quantitative MS Analysis of Tg-AD Brains (A) Experimental workflow, 14N ratio 15N is calculated and normalized to controls. (B) Quantified protein counts for 12 datasets. (C) Brain region proteome remodeling of hAPP at 3 and 12 mo. (D) Brain region proteome remodeling of hAPP/PS1 at 3 and 12 mo. (E) Bar graphs of age dependent increase of the number of significantly altered proteins (FDR-adj p value < 0.05). (F–G) Venn diagrams of significantly altered proteins. hAPP black outline = CB lacking increased Aβ levels. (H) FC summary for both models, (I) HIP summary for both models. For (B and C) Solid bars are proteins with a > 50% change in ratio 2. See also Figure S1, S6 and Table S1–3, 6.

