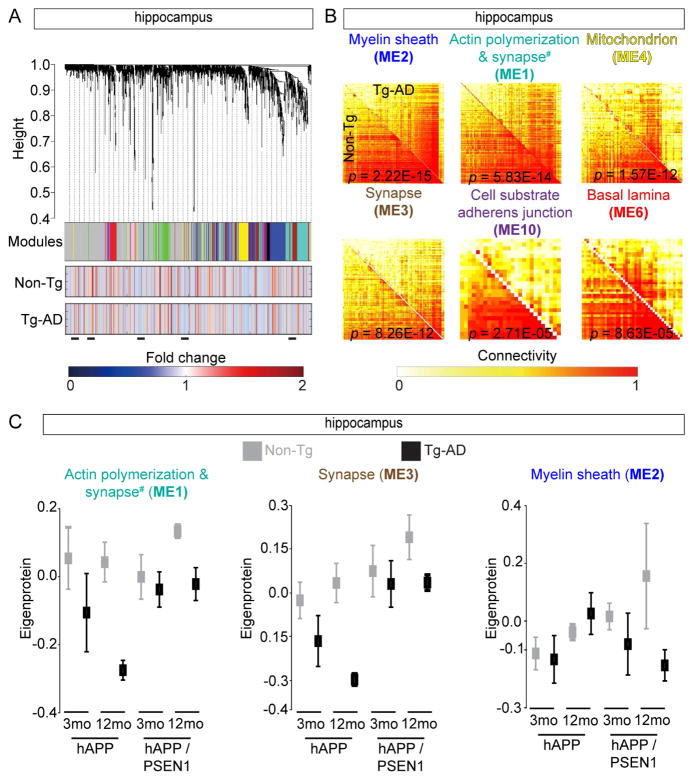
Figure 4.
Consensus Protein Coexpression Network Analysis of Tg-AD Brains (A) HIP protein clustering trees from both Tg-AD models and time points (top). Each module is in non-grey (middle). The two rows of heat maps below show the association of individual proteins with Q for Non-Tg or Tg-AD groups (bottom). Blue and red shading indicates proteins with reduced or increased expression, respectively, with increasing Q. Black bars show altered protein groups. (B) Individual topological overlap matrices of significantly (Z statistics p value < 1E-04) differentially connected modules in HIP between Tg-AD and Non-Tg datasets in both models. Module assignment based on most significant GO assignment (# for ME1 see Table S5). Shown are all modules with significant p values (< 1 E-4). (C) Summary expression value (eigenprotein) from the indicated HIP datasets, all Non-Tg/Tg-AD comparisons have p value < 0.05 calculated from Z statistics. See also Figure S4 and Table S5.

