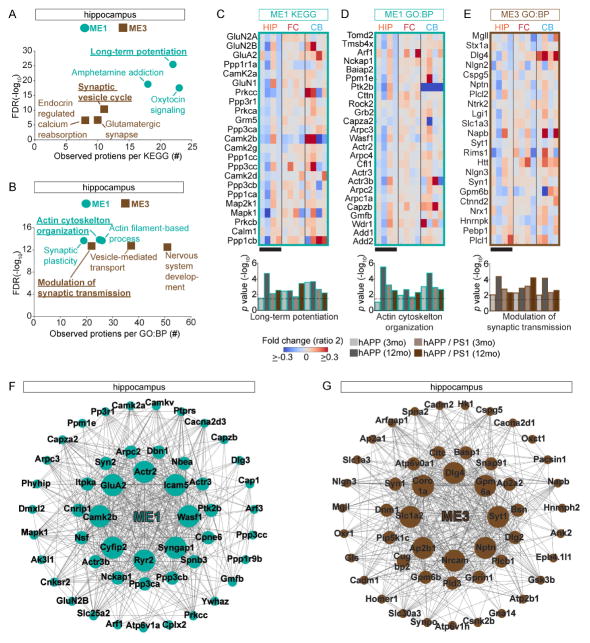
Figure 5.
Synaptic Proteins in ME1 and ME3 Have Specific Changes in Protein Levels (A) HIP ME1 and ME3 are enriched for proteins with distinct synaptic functions based on KEGG. Scatter plot showing enrichment FDR (y–axis) versus the number of proteins per KEGG pathway (x-axis). (B) HIP ME1 and ME3 are enriched in proteins with distinct synaptic functions based on GO:BP. (C–E) Protein expression matrix (ratio 2) for the indicated MEs for both Tg-AD models and time points. Black bars show datasets with contrasting protein expression patterns. Below bar graph based on hypergeometric enrichment p values, dotted line indicates an adj p value < 0.05. (F–G) Network of top 50 hub proteins in ME 1 and ME3 from the HIP (8 most connected = large, next 16 = medium, remaining 26 = small). (A and B) Most significant KEGG and GO:BP for ME1 and ME3 are underlined. See also Table S5.

